Cerrar
A continuación, encontrarán una referencia detallada de los cubos y los campos que los componen; con el fin de facilitar a los usuarios su interpretación y aprovechamiento en el mejoramiento continuo de los procesos de planeación de la demanda, en términos de precisión y automatización.
Cuando los resultados estén listos te avisaremos a tu correo. Debes hacer login en welcome.datup.ai para acceder a tus resultados. Acá podrás encontrar los Cubos de datos descargables, los cuales podrás ver en excel o google sheets.
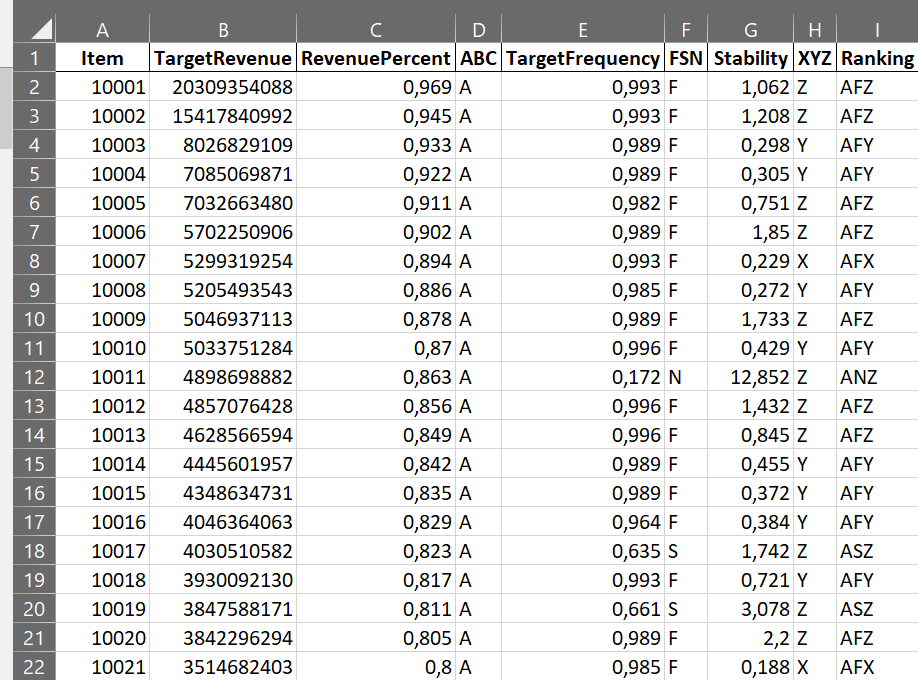
Consolida la clasificación de cada item según los ranking ABC, FSN y XYZ. El primero se refiere a la rentabilidad o ingresos del item; el segundo al nivel de movimiento y el tercero a la estabilidad del item para un proceso de pronóstico.
Reune los pronósticos y backtests (evaluaciones de las datos históricos contra las predicciones del modelo) por cada item y fechas del período a predecir, sugiriendo las cantidades de venta o demanda más probables para los procesos de operación, fabricación, abastecimiento o S&OP.
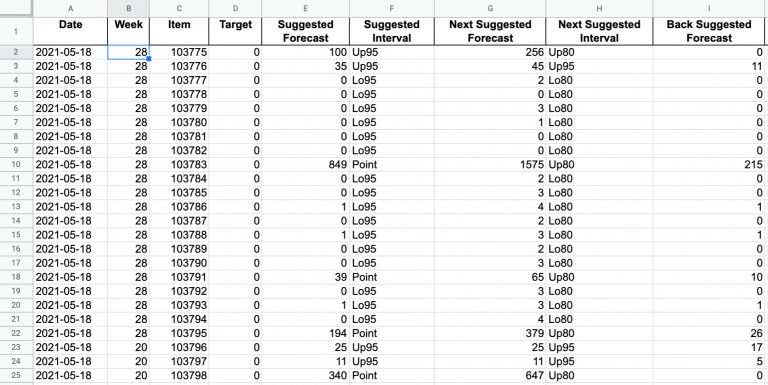
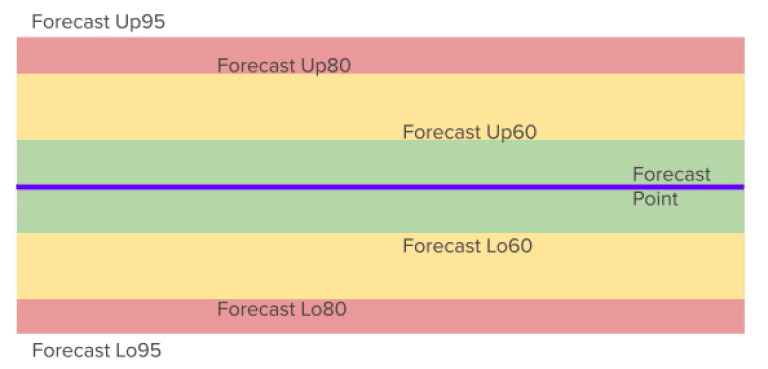
Los intervalos de pronóstico son las zonas de impacto de los pronósticos, medidos como la desviación de los pronósticos con respecto a la observación real. Estas zonas estan delimitadas por: Forecast Point, Forecast Lo95, Forecast Lo80, Forecast Lo60, Forecast Up60, Forecast Up80 y Forecast Up95.
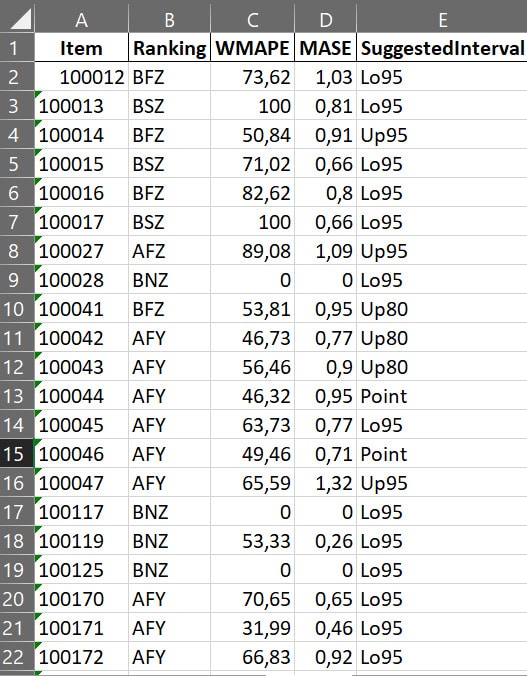
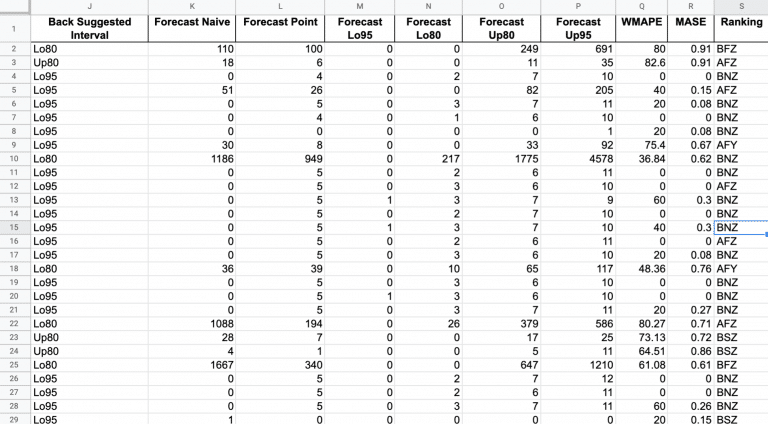
Resume los resultados más relevantes del pronóstico por cada item para guiar los procesos de mejoramiento continuo de planeación de la demanda. En primer lugar, permite identificar los items de mayor, los items por encima de un valor de error de control (e.g. 50%), los items con mejor rendimiento por un pronóstico ingenuo o modelo propuesto, y el intervalo de pronóstico que mejor describe un sub o sobrepronóstico recurrente.
