How-To: Interpretar los Cubos de Resultados
A continuación, encontrarán una referencia detallada de los cubos de pronósticos de precios de materias primas y los campos que los componen; con el fin de facilitar a los usuarios su interpretación y aprovechamiento en el mejoramiento continuo de los procesos de planeación, en términos de precisión y eficiencia.
Qmfcst-week: Cubo de Pronósticos
Reúne los pronósticos y backtests semanales (evaluaciones de las datos históricos contra las predicciones del modelo) por cada ítem y fechas del período a predecir, sugiriendo los precios más probables para los procesos de operación, abastecimiento o S&OP.
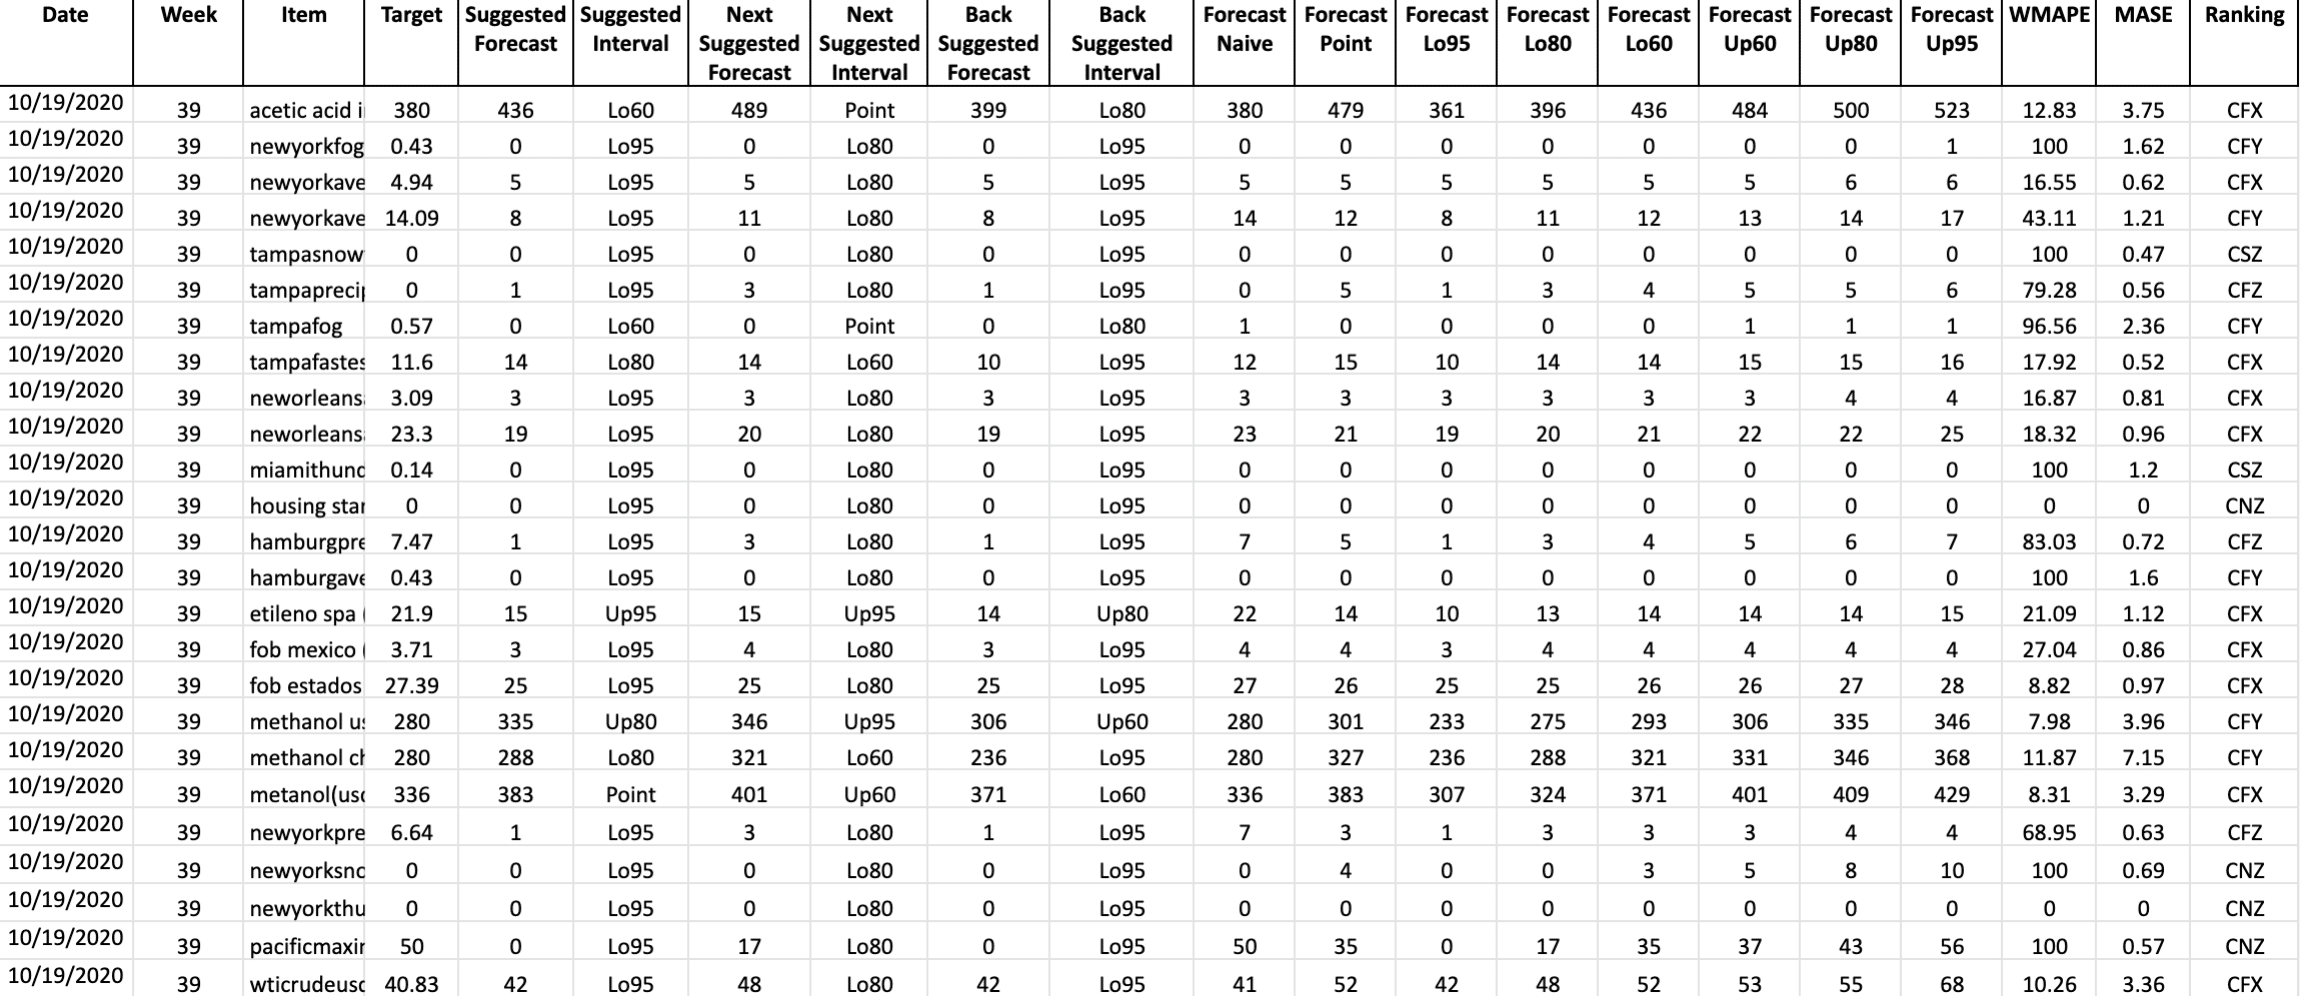
| Nombre Columna | Descripción | Interpretación |
|---|---|---|
| Date | Fecha del histórico y predicción. | |
| Week | Número de la semana del año. | |
| Item | Identificación única de los ítems o referencias que componen el portafolio de productos. | |
| Target | Observación real o comportamiento histórico real de un ítem particular para una fecha específica. | |
SuggestedForecast | Valores de compra pronosticadas para un ítem particular y fecha específica. | Se debe tomar como el valor de compra más probable a observarse en el período o fecha pronosticada. |
SuggestedInterval | Intervalo de pronóstico asociado a los valores de compra pronosticados. | Permite identificar si los precios más probable de compra son más cercanos a un subpronóstico (Up60, Up80, Up95) o a un sobrepronóstico (Lo60, Lo80, Lo95) |
NextSuggestedForecast | Valores de compra sobrepronosticados para un ítem particular y fecha específica. | En las sesiones de S&OP permite proponer un valor mayor de pronóstico más probable- al considerar que el SuggestedForecast es conservador. |
| NextSuggestedInterval | Intervalo de pronóstico asociado a la cantidad de unidades sobrepronosticadas | Permite identificar si los valores más probable de compra, por encima, es más cercano a un subpronóstico (Up60- Up80- Up95) o a un sobrepronóstico (Lo60- Lo80- Lo95) |
| BackSuggestedForecast | Valores de compra subpronosticados para un ítem particular y fecha específica. | En las sesiones de S&OP permite proponer un valor menor de pronóstico más probable, al considerar que el SuggestedForecast es optimista. |
| BackSuggestedInterval | Intervalo de pronóstico asociado a la los valores de compra subpronosticados. | Permite identificar si los valores más probables de compra por debajo- es más cercano a un subpronóstico (Up60, Up80, Up95) o a un sobrepronóstico (Lo60, Lo80, Lo95) |
ForecastNaive | Valores de compra pronosticados, según el pronóstico ingenuo. Es decir, la predicción es igual a la última observación real. | Pronóstico de respaldo para que aquellos ítems y fechas con errores superiores al valor de control (e.g. 50%) y la medida de error comparativa MASE es mayor a 1. |
ForecastPoint | Valores de compra pronosticados estimados por el modelo para el intervalo punto. | Valor de pronóstico central generado por el modelo para un item y fecha específica. El pronóstico tiene 50% de probabilidad de ubicarse en el Forecast Point. |
ForecastLo95 | Valores de compra pronosticados estimadas por el modelo para el intervalo Lo95. | Valor de pronóstico más bajo posible, generado por el modelo para un item o fecha específica. El pronóstico tiene 95% de probabilidad de ubicarse entre el Lo95 y el Forecast Point. |
ForecastLo80 | Valores de compra pronosticados estimadas por el modelo para el intervalo Lo80. | Segundo valor de pronóstico más bajo posible, generado por el modelo para un item o fecha específica. El pronóstico tiene 80% de probabilidad de ubicarse entre el Lo80 y el Forecast Point. |
ForecastLo60 | Valores de compra pronosticados estimadas por el modelo para el intervalo Lo60. | Tercer valor de pronóstico más bajo posible, generado por el modelo para un item o fecha específica. El pronóstico tiene 60% de probabilidad de ubicarse entre el Lo60 y el Forecast Point. |
ForecastUp60 | Valores de compra pronosticados estimadas por el modelo para el intervalo Up60. | Tercer valor de pronóstico más alto posible, generado por el modelo para un item o fecha específica. El pronóstico tiene 60% de probabilidad de ubicarse entre el Forecast Point y el Up60. |
ForecastUp80 | Valores de compra estimados por el modelo para el intervalo Up80. | Segundo valor de pronóstico más alto posible, generado por el modelo para un item o fecha específica. El pronóstico tiene 80% de probabilidad de ubicarse entre el Forecast Point y el Up80. |
ForecastUp95 | Valores de compra pronosticados estimadas por el modelo para el intervalo Up95. | Valor de pronóstico más alto posible, generado por el modelo para un item o fecha específica. El pronóstico tiene 95% de probabilidad de ubicarse entre el Forecast Point y el Up95. |
WMAPE | Medida de error de pronóstico, Weighted Mean Absolute Percentage Error. | Permite evaluar el desempeño de la predicción del modelo para cada ítem. Por lo general, se evalúa en franjas de control: 0-30% (excelente), 30-50% (aceptable), +50% (deficiente). |
MASE | Medida de error de pronóstico comparativo, Mean Absolute Scaled Error. | Permita evaluar el desempeño de la predicción del modelo para cada ítem, comparando el error del modelo propuesta contra el error del pronóstico ingenuo (Forecast Naive). Los errores menores a 1 demuestran que el modelo propuesto tiene mejor desempeño. |
Ranking | Unión de clasificaciones ABC, FSN y XYZ, según los criterios de ingreso/rentabilidad- movimiento y estabilidad | Los ítems de mayor valor para el negocio son los AFX, AFY y AFZ. Los ítems de menor valor para el negocio son CNX, CNY y CNZ |
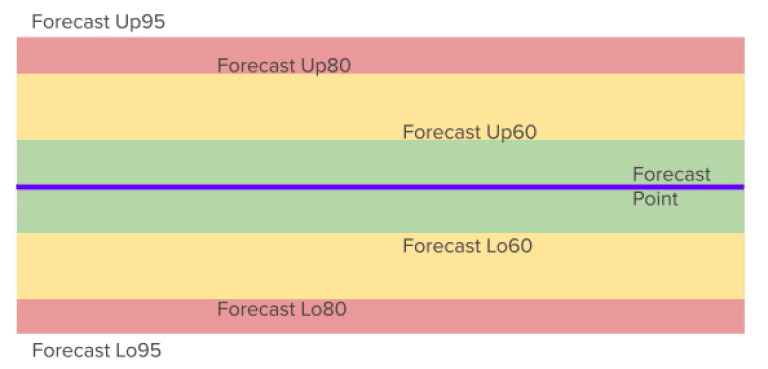
Los intervalos de pronóstico son las zonas de impacto de los pronósticos, medidos como la desviación de los pronósticos con respecto a la observación real. Estas zonas estan delimitadas por: Forecast Point, Forecast Lo95, Forecast Lo80, Forecast Lo60, Forecast Up60, Forecast Up80 y Forecast Up95.
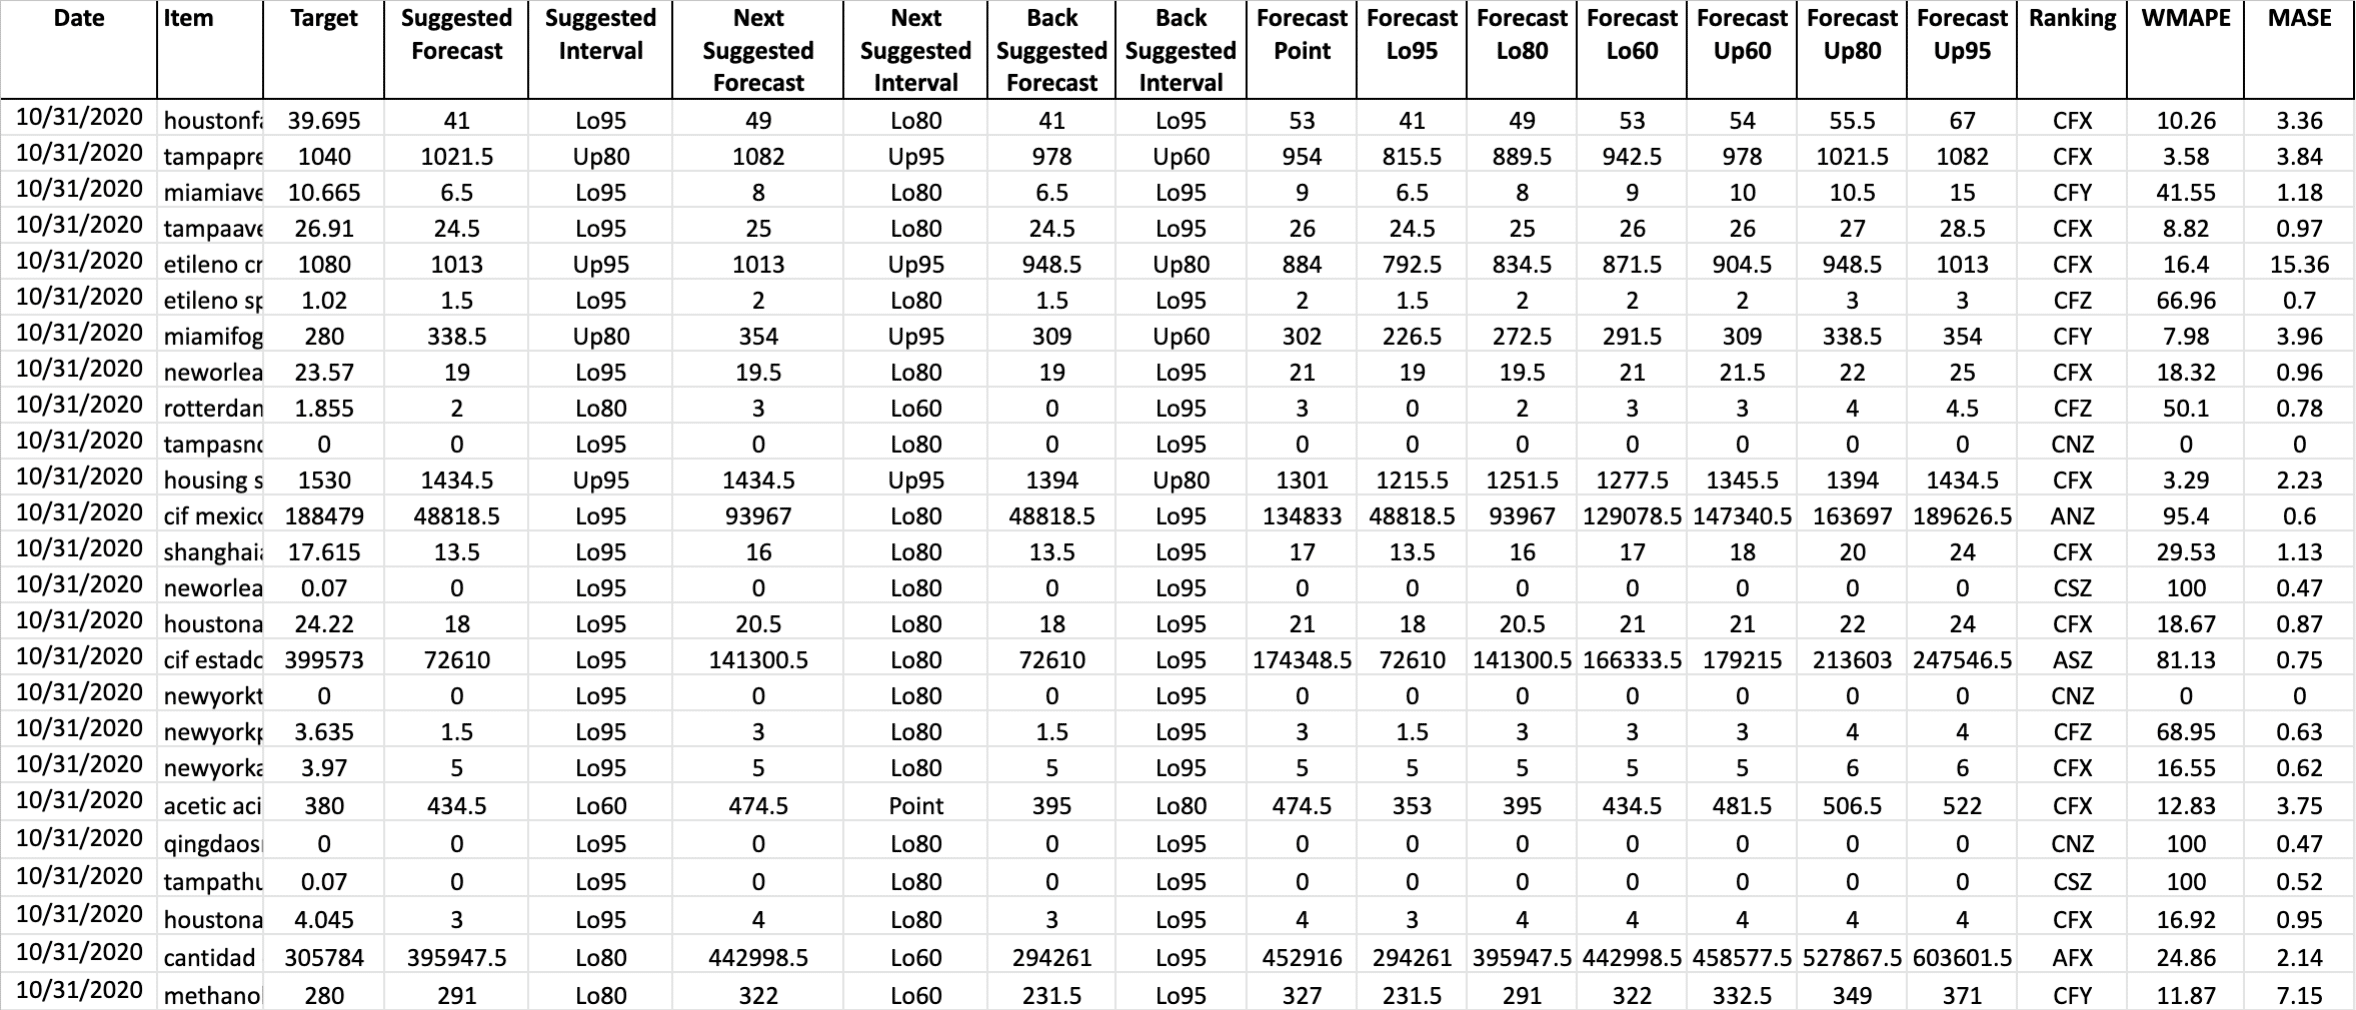
Qmfcst-mo: Cubo de Pronósticos
Reúne los pronósticos y backtests del mes (evaluaciones de las datos históricos contra las predicciones del modelo) por cada ítem y fechas del período a predecir, sugiriendo los precios más probables para los procesos de operación, fabricación, abastecimiento o S&OP.
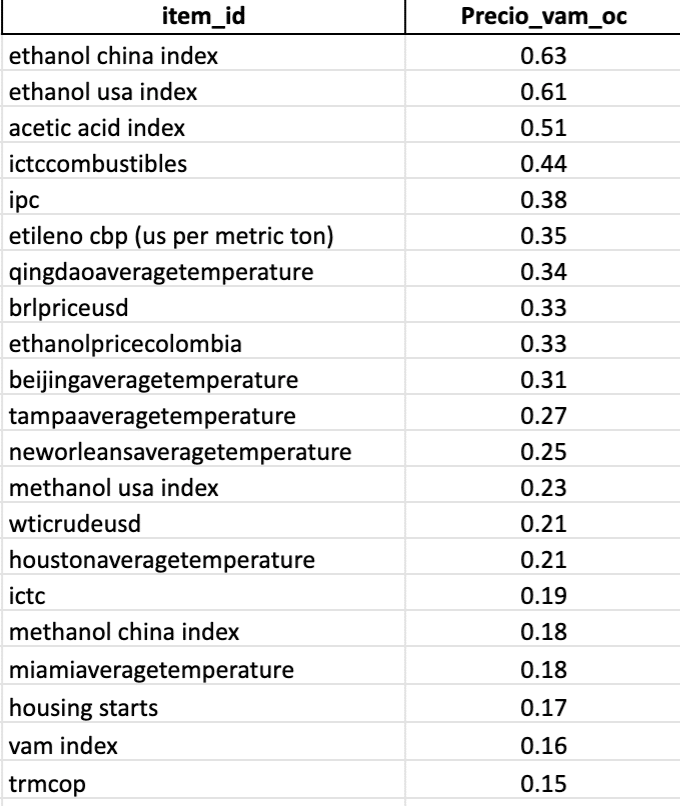
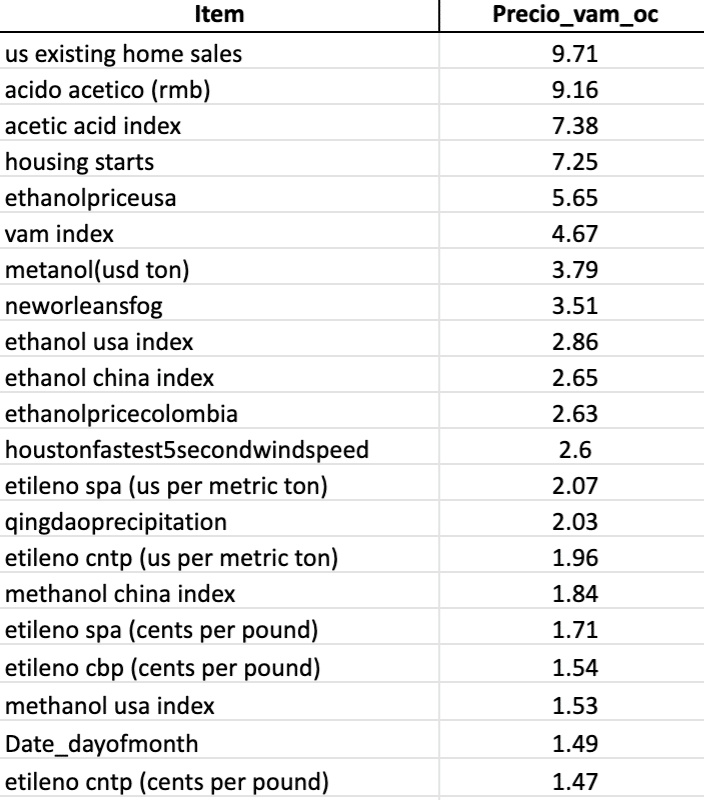
Qimportance: Cubo de importancia
Enseña el impacto de las variables más relevantes que se están incluyendo en el pronóstico, este cubo se organiza de mayor a menor los ítems o variables que tiene mayor importancia o incidencia porcentual en el pronóstico y en los demás ítems cuando estos presenten alguna variación.
Qcorrelation: Cubo de Correlación
En este cubo señala cuáles son los ítems cuya historia es directa o inversamente relacionada con una variable particular, subiendo o bajando en la misma proporción. Cuando son inversamente correlacionados mientras una variable sube, normalmente la otra tiende a bajar en la misma proporción.
La correlación se mide de 1 a -1 donde 1 es un valor altamente correlacionado y -1 es inversamente correlacionado y cualquier valor que esté entre 0.6 o -0.6 son variables débilmente correlacionadas, significa que no tienen una correlación significativa entre sí.
Es importante mencionar que en el cubo encontrarás los resultados organizados de mayor a menor correlación para facilitar el análisis de los datos.

Qcausality: Cubo de causalidad
Por último, el cubo de causalidad muestra cuando una variable tiene un efecto directo sobre otra variable del pronóstico. Su comportamiento hacia arriba o hacia abajo es una causa del comportamiento de la variable de interés. Es decir, cuando hay una variación en un ítem o variable A, afecta un ítem B. En este apartado binario donde se define si la variable es causal o no es causal.
La causalidad se mide de la siguiente manera, si el ítem o variable es superior a 0 se dice que es causal, – 0 no casual. No obstante, en el cubo se presentan los resultados organizados de mayor a menor casualidad para facilitar el análisis de estos.
