
🇺🇸
In nec dictum adipiscing pharetra enim etiam scelerisque dolor purus ipsum egestas cursus vulputate arcu egestas ut eu sed mollis consectetur mattis pharetra curabitur et maecenas in mattis fames consectetur ipsum quis risus mauris aliquam ornare nisl purus at ipsum nulla accumsan consectetur vestibulum suspendisse aliquam condimentum scelerisque lacinia pellentesque vestibulum condimentum turpis ligula pharetra dictum sapien facilisis sapien at sagittis et cursus congue.
Convallis pellentesque ullamcorper sapien sed tristique fermentum proin amet quam tincidunt feugiat vitae neque quisque odio ut pellentesque ac mauris eget lectus. Pretium arcu turpis lacus sapien sit at eu sapien duis magna nunc nibh nam non ut nibh ultrices ultrices elementum egestas enim nisl sed cursus pellentesque sit dignissim enim euismod sit et convallis sed pelis viverra quam at nisl sit pharetra enim nisl nec vestibulum posuere in volutpat sed blandit neque risus.

Feugiat vitae neque quisque odio ut pellentesque ac mauris eget lectus. Pretium arcu turpis lacus sapien sit at eu sapien duis magna nunc nibh nam non ut nibh ultrices ultrices elementum egestas enim nisl sed cursus pellentesque sit dignissim enim euismod sit et convallis sed pelis viverra quam at nisl sit pharetra enim nisl nec vestibulum posuere in volutpat sed blandit neque risus.
Feugiat vitae neque quisque odio ut pellentesque ac mauris eget lectus. Pretium arcu turpis lacus sapien sit at eu sapien duis magna nunc nibh nam non ut nibh ultrices ultrices elementum egestas enim nisl sed cursus pellentesque sit dignissim enim euismod sit et convallis sed pelis viverra quam at nisl sit pharetra enim nisl nec vestibulum posuere in volutpat sed blandit neque risus.
Vel etiam vel amet aenean eget in habitasse nunc duis tellus sem turpis risus aliquam ac volutpat tellus eu faucibus ullamcorper.
Sed pretium id nibh id sit felis vitae volutpat volutpat adipiscing at sodales neque lectus mi phasellus commodo at elit suspendisse ornare faucibus lectus purus viverra in nec aliquet commodo et sed sed nisi tempor mi pellentesque arcu viverra pretium duis enim vulputate dignissim etiam ultrices vitae neque urna proin nibh diam turpis augue lacus.
Do you know why these classifications are so important to your business?
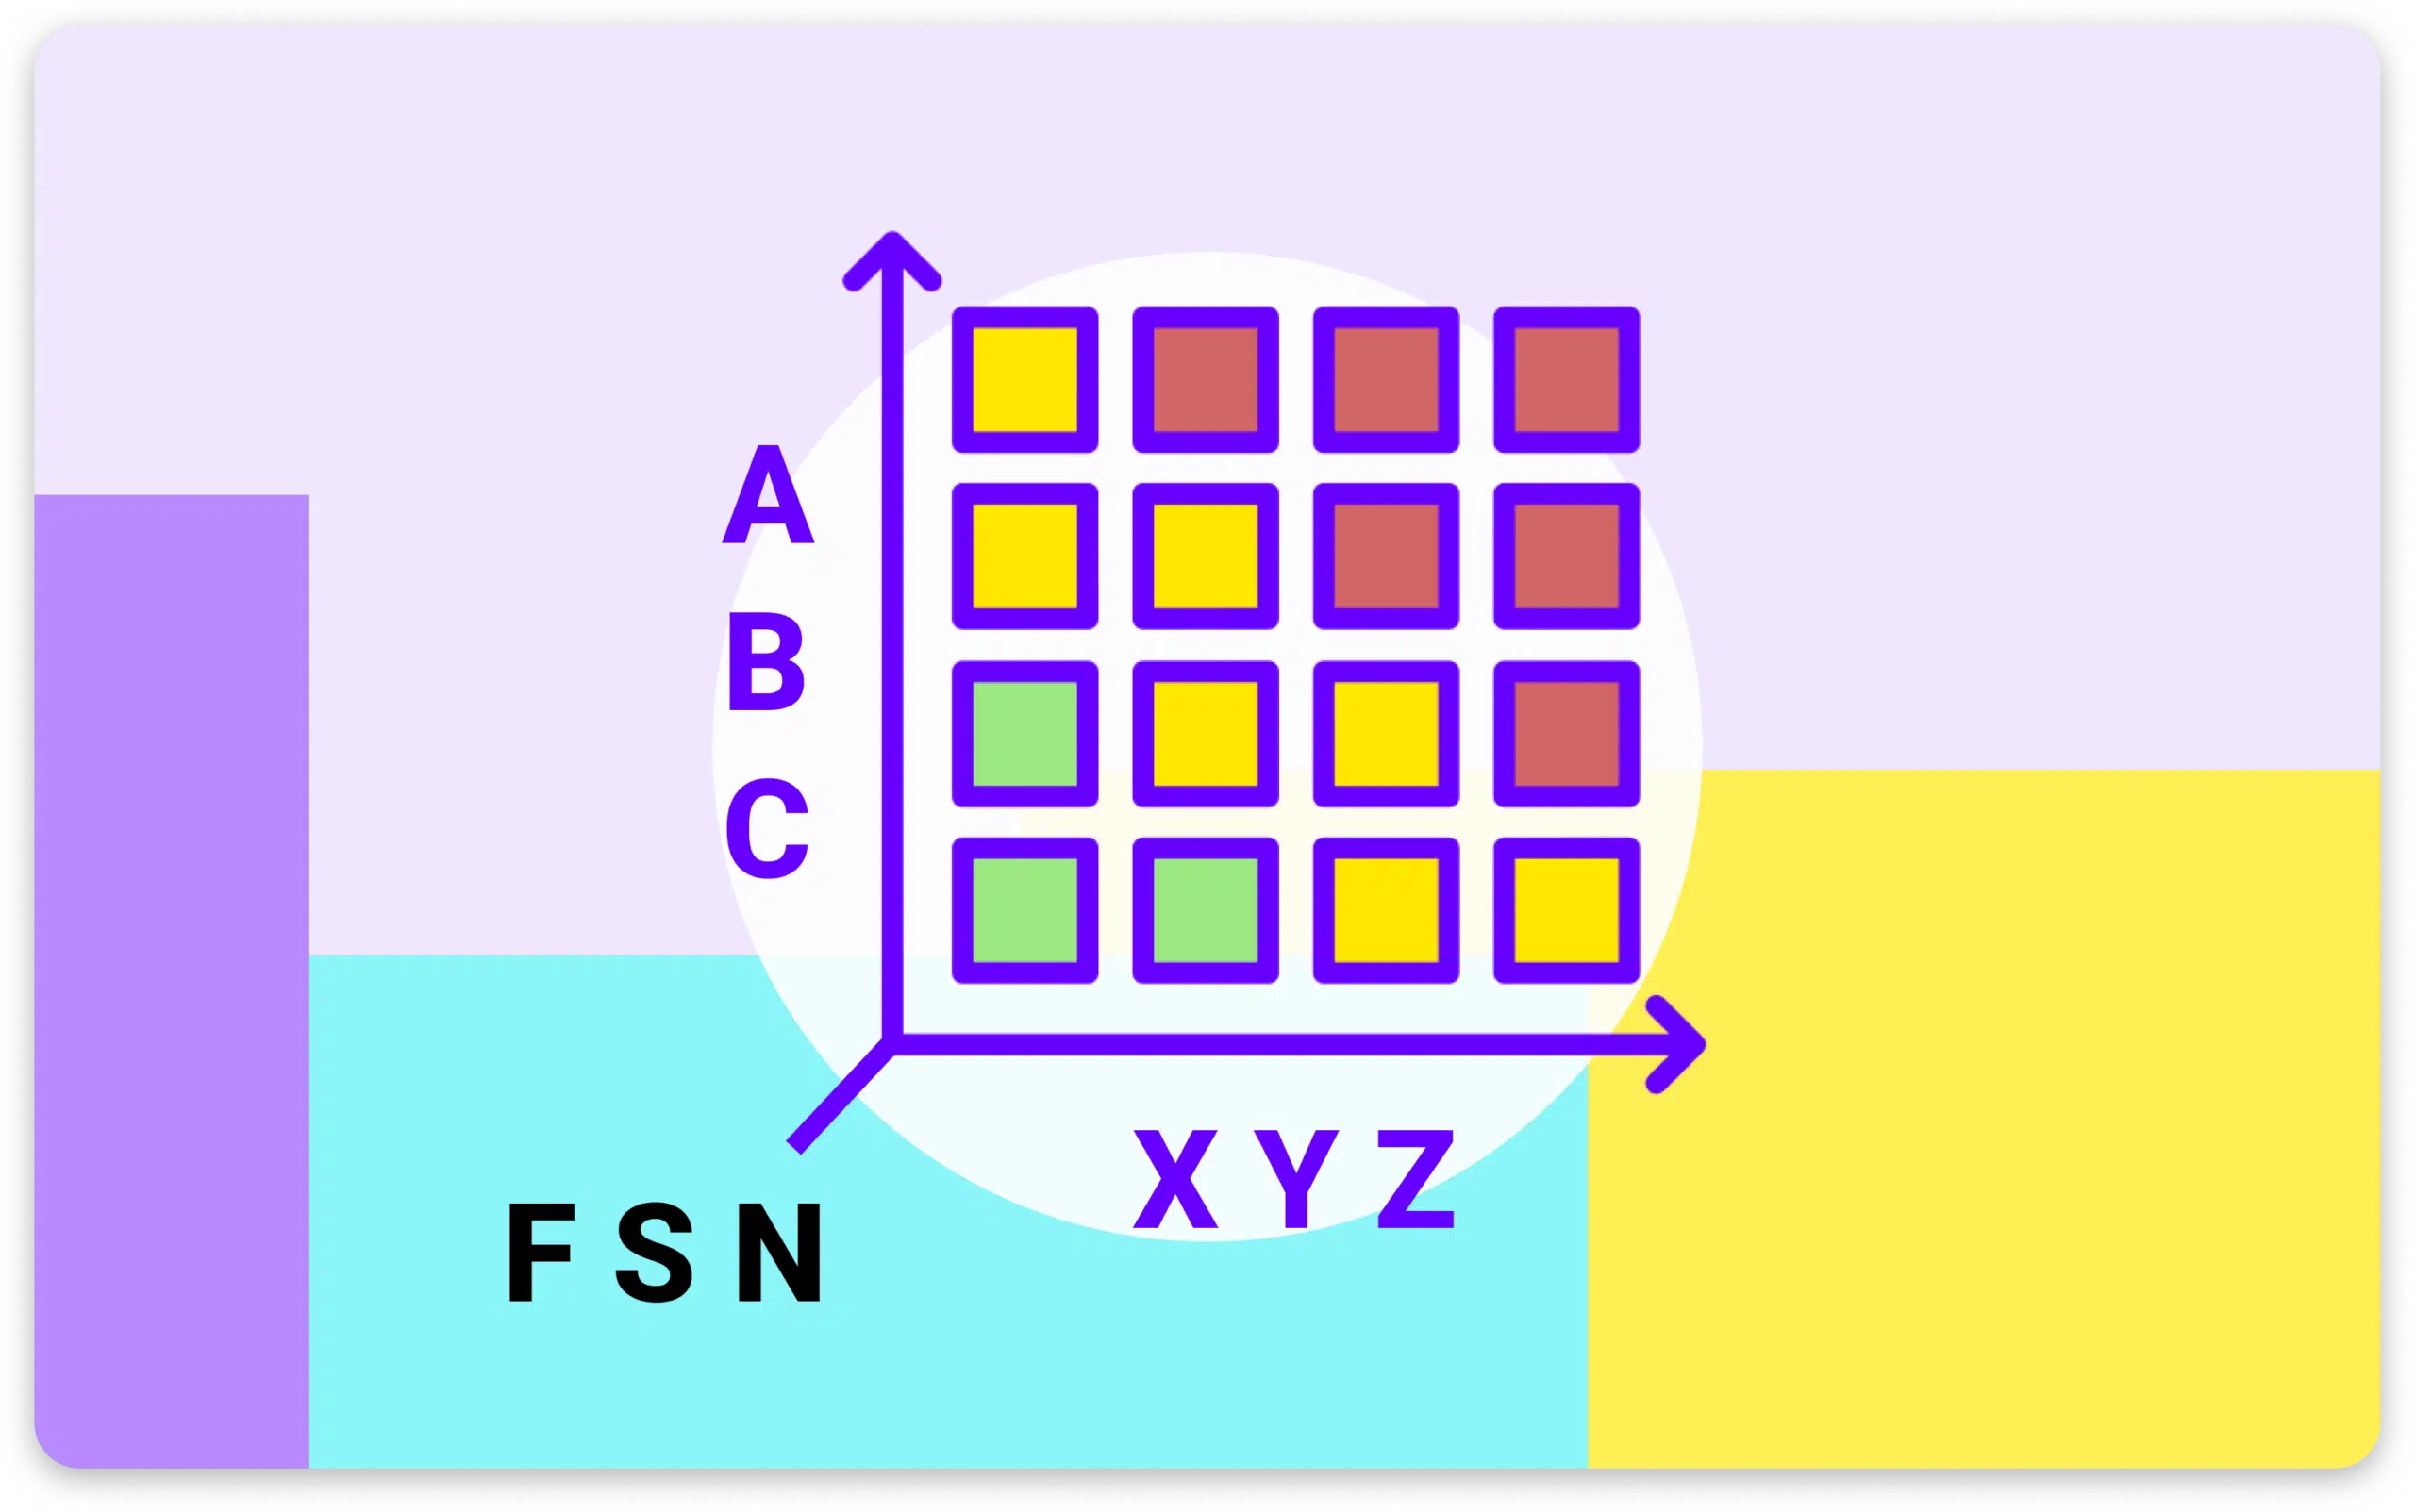
Rankings or classifications make it possible to identify groups of SKUs that behave in a similar way according to different segmentation criteria.
The common ones most used by the industry are the classifications made by revenue share (ABC), variability in demand (XYZ) and order frequency or speed (FSN).
By convention, the SKU portfolio, if these rankings are used, is classified into 3 groups depending on the segmentation criteria chosen.


The ABC ranking is the first of the rankings in the supply chain and one of the most popular. This ranking is a classification or categorization system for products, raw materials, costs and transactions (If you read these last 2 types correctly!!) , which divides them into three categories A, B and C depending on their individual share of the company's revenues, demand or costs, in order to make differentiated and strategic management for each of these categories. Category A is assigned to products, raw materials, costs, and transactions that are critical to the business. Category B to those who have an average importance within the business and a category C to those who have a low importance but that should not stop being produced or sold by the company. This classification is based on the Pareto Principle, which gets its name thanks to its creator Vilfredo Pareto, a French economist, who in 1896 stated his principle for the first time studying land ownership in Italy, and in which he discovered that 80% of the land belonged to 20% of the clearly wealthy population, and the other 20% of the remaining land belonged to 80% of the population, clearly making them a minority without so many monetary resources and purchasing power. This principle applies to many aspects of our daily lives and specifically to supply chain, the Pareto principle is taking more effect than ever. 80% of the items we produce or the transactions we carry out generate only 20% of our profits, while the minority of 20% generate 80% of our profits. These proportions, in the same way, are applicable to the total costs that are handled day to day in the production or acquisition of the products or services that we sell or for the total demand that is managed. The ABC ranking takes this principle and establishes a category A, to group these items of great importance to the business, which are only 20% of our total items/transactions or services, but which will generate 80% of our profits. Category B is concentrated on 30% of the items that generate approximately 15% of profits for our company and category C, equivalent to the remaining 50%, generates 5% of profits. These values are approximate and may change slightly depending on the nature of your company, however the general principle will remain in force.

The XYZ ranking unlike ABC, It does the segmentation, classification and ordering of the SKUs according to the index of variation in demand, costs or sales.
The objective is to find out how many and which are the SKUs with low, medium or high difficulty, depending on the variation during the analysis period.
Unlike the ABC ranking, classification thresholds may vary according to the characteristics of the business and the data, in which the ranking is implemented.
However, there are some standard or initial ranges, in which items X or items of least difficulty or regular behavior, are those with an index of variation less than or equal to the range of 25%-33%, The Y or medium difficulty items whose variation index is less than or equal to the range between 66%-75% and Z or high difficulty items they correspond to any value that the index of variation takes higher than the previous ranges.

The third ranking commonly used in the supply chain is the FSN ranking. This ranking classifies and orders the SKUs according to their frequency or speed of movement of demand, costs or sales.
The objective is to find out how many and what are the SKUs with frequent or fast movement, intermittent or slow and static.
Like the XYZ ranking, the classification thresholds may vary according to the characteristics of the business and the data, in which the ranking is implemented.
However, they can be taken F or fast-moving items with an intermittency of less than or equal to 50%, The S or intermittent items those who manage intermittency between 50% and 75% and finally N or non-static items correspond to any item that intermittently has a value greater than the previously defined ranges.
The rankings presented above are not mutually exclusive, nor do they have a greater importance than one over the other.
Each of them is valuable and the need to implement one or all three will depend exclusively on the needs, specifications and dynamics of your market and your business.
However, when a company decides to implement them together, it manages to obtain a complete picture of the behavior of the items over time.
Knowing in detail the category or categories of each of the items according to the classification criteria used is essential information in our supply chain regardless of the product or service we offer, they are a living indicator that allows us to concentrate our efforts on generating value items, establishing changes in demand and optimizing the costs associated with estimating inventories and our value chain in general, to serve and keep our customers satisfied without having more or less inventory than we require to produce and/or distribute.
Precisely because of the importance mentioned above, the ABC, XYZ and FSN rankings are not a classification that should be done only once and written in stone, but rather they must be done continuously, in order to include the trends, seasonality and outliers that our demand is presenting.
These rankings are the foundation and indispensable input within our supply chain to carry out, among others, the following processes:
Although the rankings presented within the supply chain have a much deeper background than simply managing an inventory, we are aware that when we handle a high volume of items, products, services or transactions, integrating all the information about each of them, their costs, demand, and other variables, is not an easy task, but on the contrary requires human resources and time to prepare them.
This is where you can leverage technology and let it generate the results you require, allowing you to focus your time and that of your work team on analyzing and generating policies and rules for your business in each of the groups of items.
La artificial intelligence It is one of the technologies that you should not miss out on in optimizing the process of generating the ABC, XYZ and FSN rankings. Especially when the volumes of items you handle are very high.
Do you know that any of the rankings mentioned above can be generated using artificial intelligence in seconds instead of weeks?
And that this input will be updated taking into account your demand, its seasonality and changes that may occur in it? Or that the error in the classification will be much smaller?
Well, these are just some of the many advantages that carrying out your classification processes through the ABC, XYZ and FSN Rankings automated through artificial intelligence have to offer for you, your work team and your company.
Remember that these well-designed rankings result in the following processes in your supply chain until customer satisfaction is achieved, they are more accurate and are guided by up-to-date and truthful information; and not simply by an inventory or classification that is not so up-to-date, which does not reveal the reality of the operations in your business. Rankings are the first step in making more appropriate decisions about policies or guidelines for managing our inventories based on the current demands of our customers and generating operational efficiencies. Especially when we have a considerable volume of items in our company, having a simple inventory or making gradual updates or simple physical movements of the items, will not ensure that costs are properly managed, much less that storage levels, production and distribution times, and customer satisfaction are optimal. That's why our final invitation is to give importance to the ABC, XYZ and FSN Ranking processes, as a starting point for optimizing your supply chain, know what your Pareto products are, what is their variability in demand and movement, and rely on new technologies such as artificial intelligence to enjoy its benefits, allowing you to channel your efforts and resources into optimizing costs, time and valuable resources for your organization. If you want to know how we are involved in Datup the artificial intelligence in the supply chain visit our website and subscribe to our blog for more information of your interest!


