🇺🇸
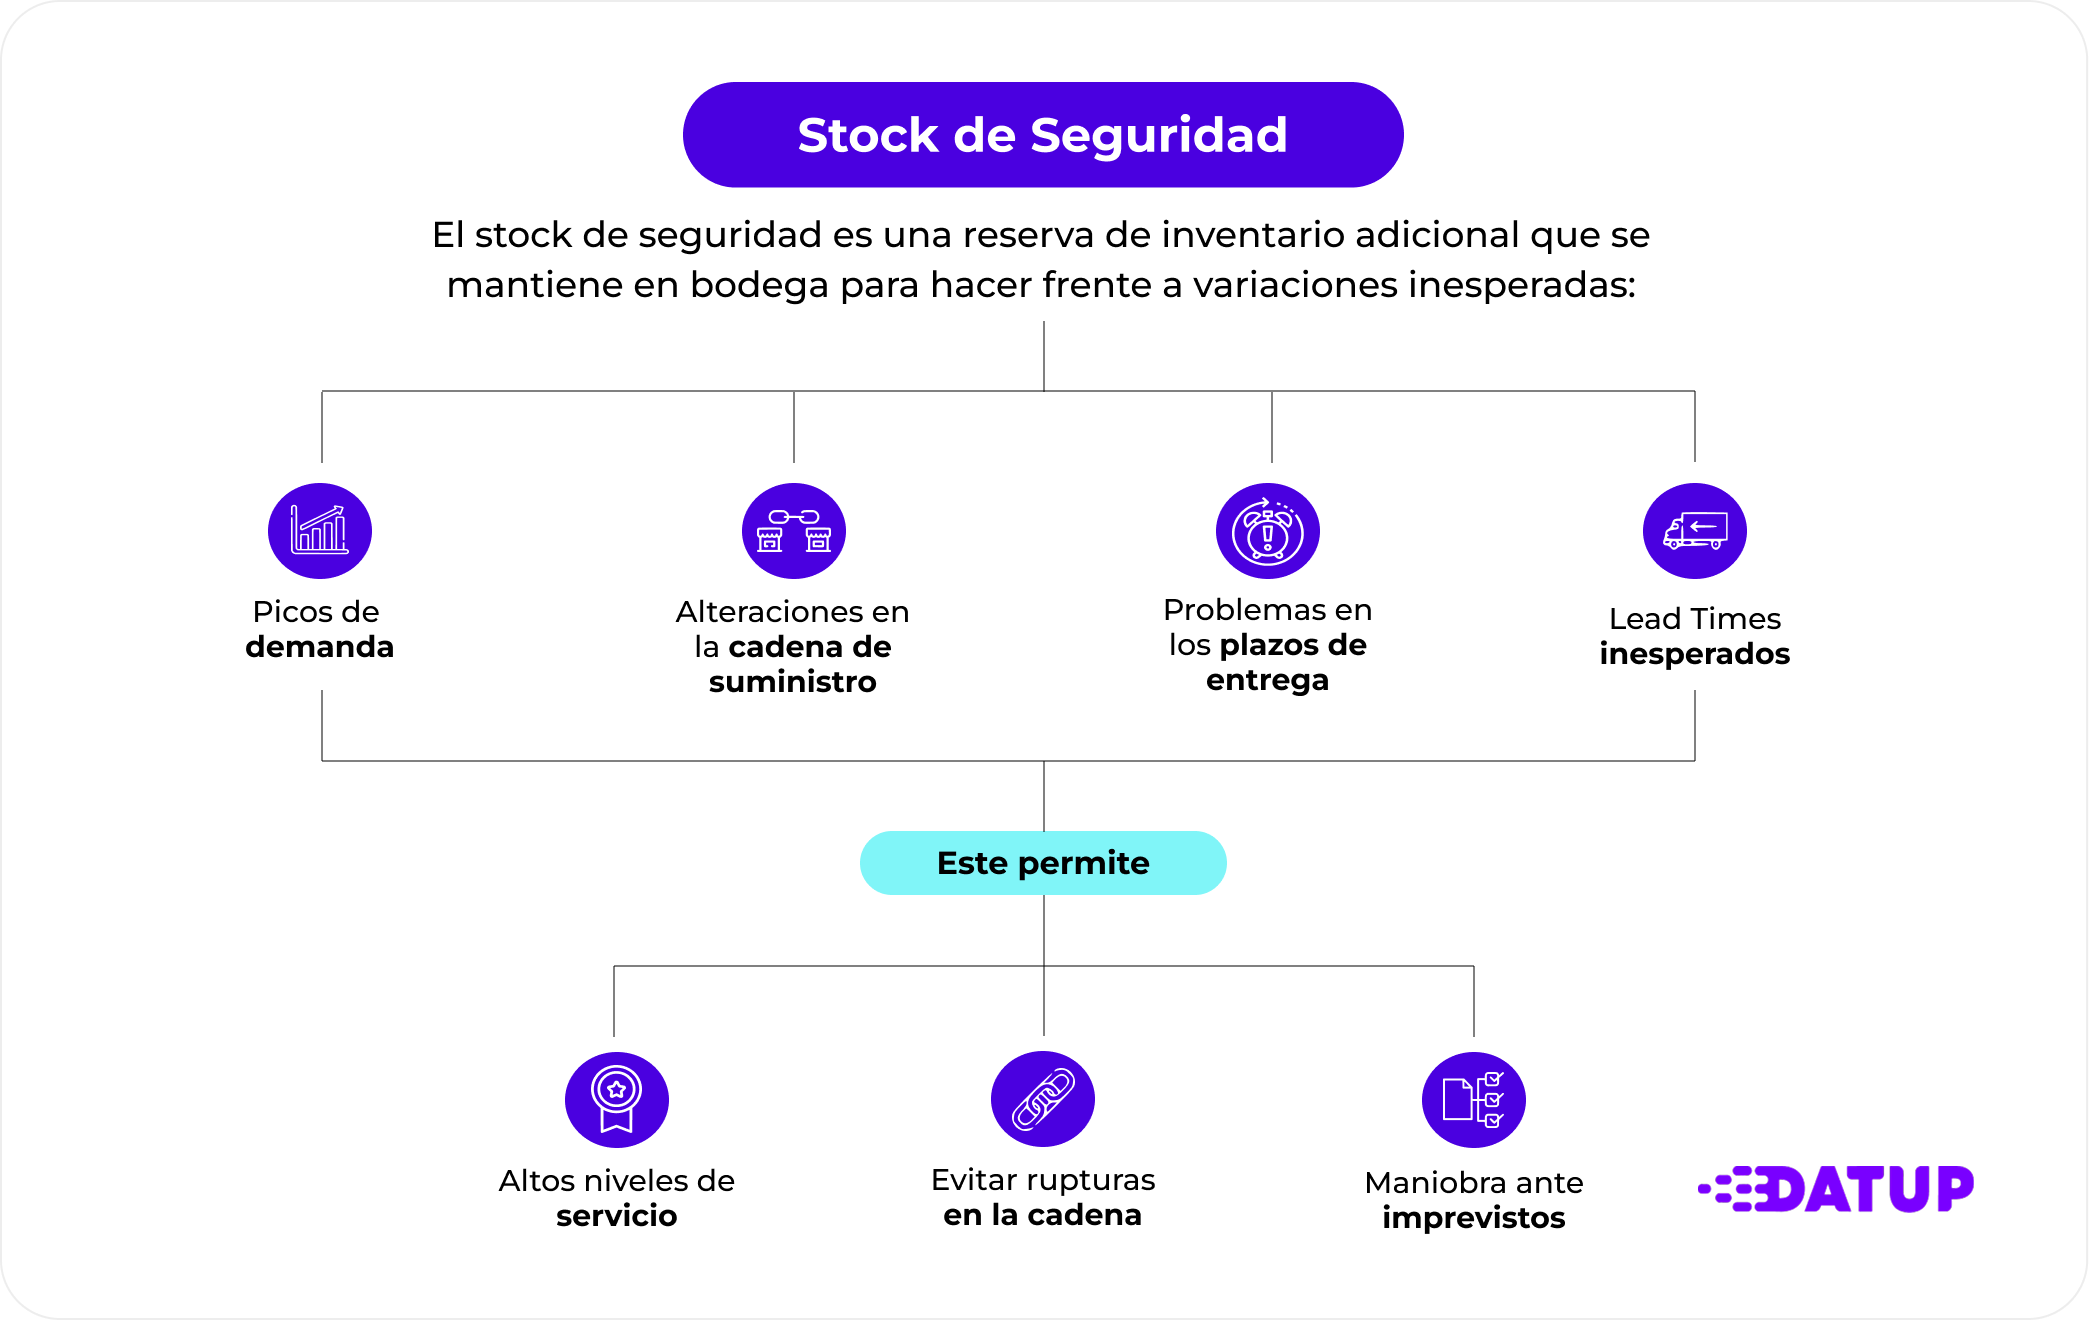
In supply chain, preventing stockouts is one of the key day-to-day tasks. One of the most effective tools for it is safety stock, also known as buffer stock. It helps you absorb the unexpected: sudden demand spikes, supplier delays or planning errors.
In this article, we explain what safety stock is, how to calculate it and why building it into your inventory strategy can make the difference between hitting your service levels or missing them.
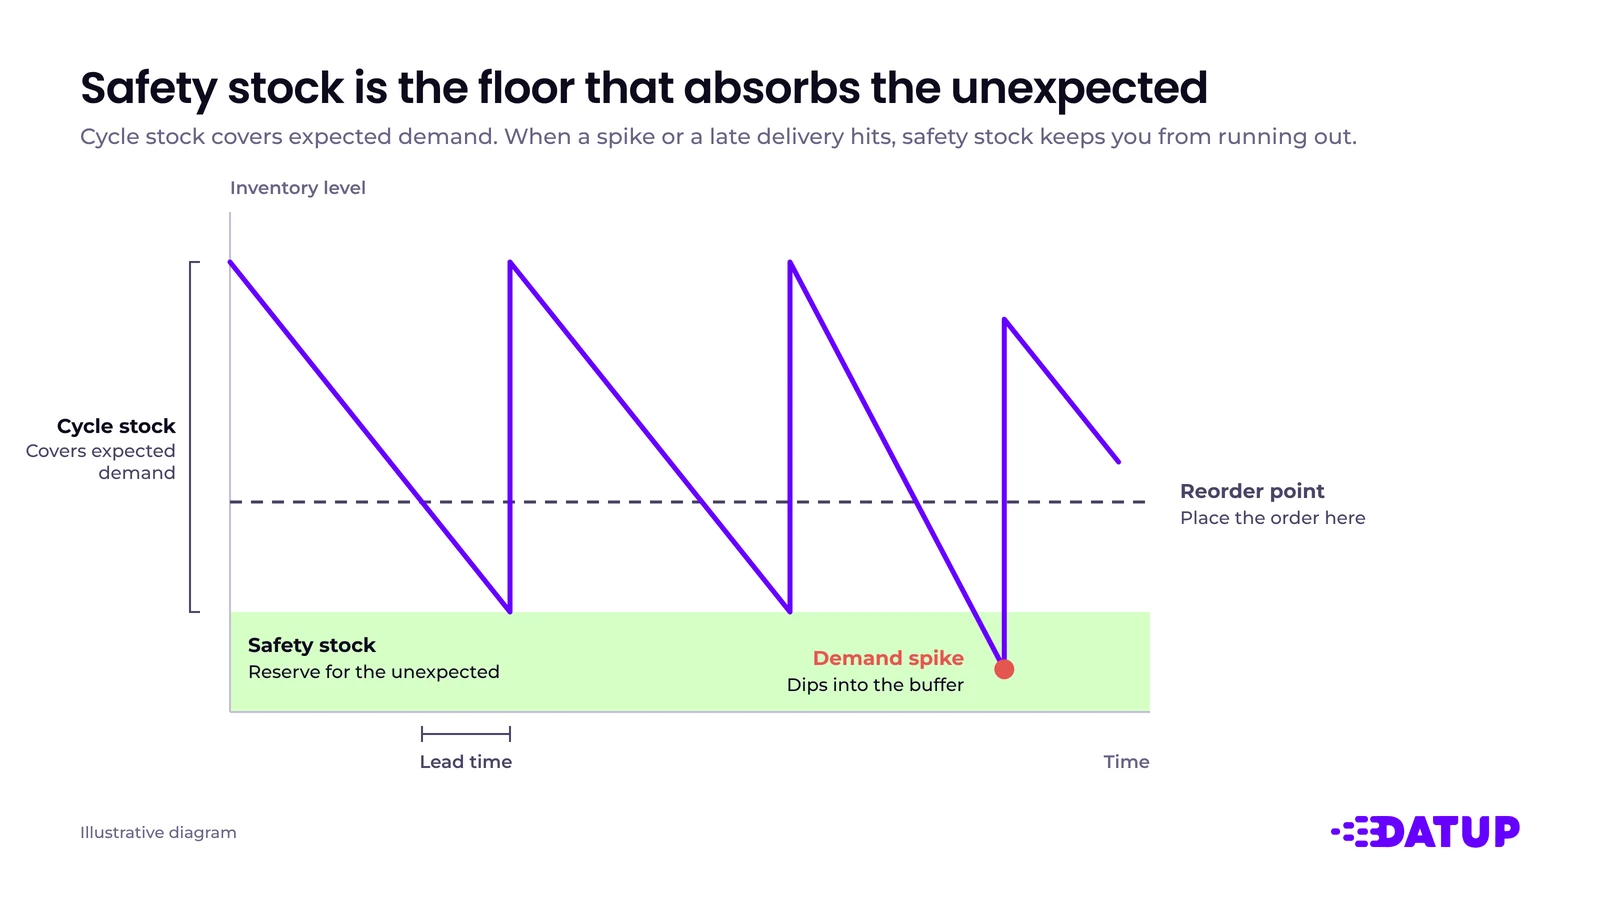
Safety stock (also called safety inventory) is extra inventory you keep in the warehouse to cover unexpected swings in demand or supply problems.
What is it for? Its job is to keep operations running when cycle stock runs out faster than planned or when suppliers don't deliver on time.
It's especially useful for high-turnover products, items that are critical to the operation, or periods of high uncertainty. A well-calculated safety stock reduces the risk of stockouts, prevents losses from missing product and improves the customer experience.
How you calculate safety stock depends on several factors and on the nature of your product and company. Still, there's a standard way to calculate it that works as a guide if you're doing it for the first time.
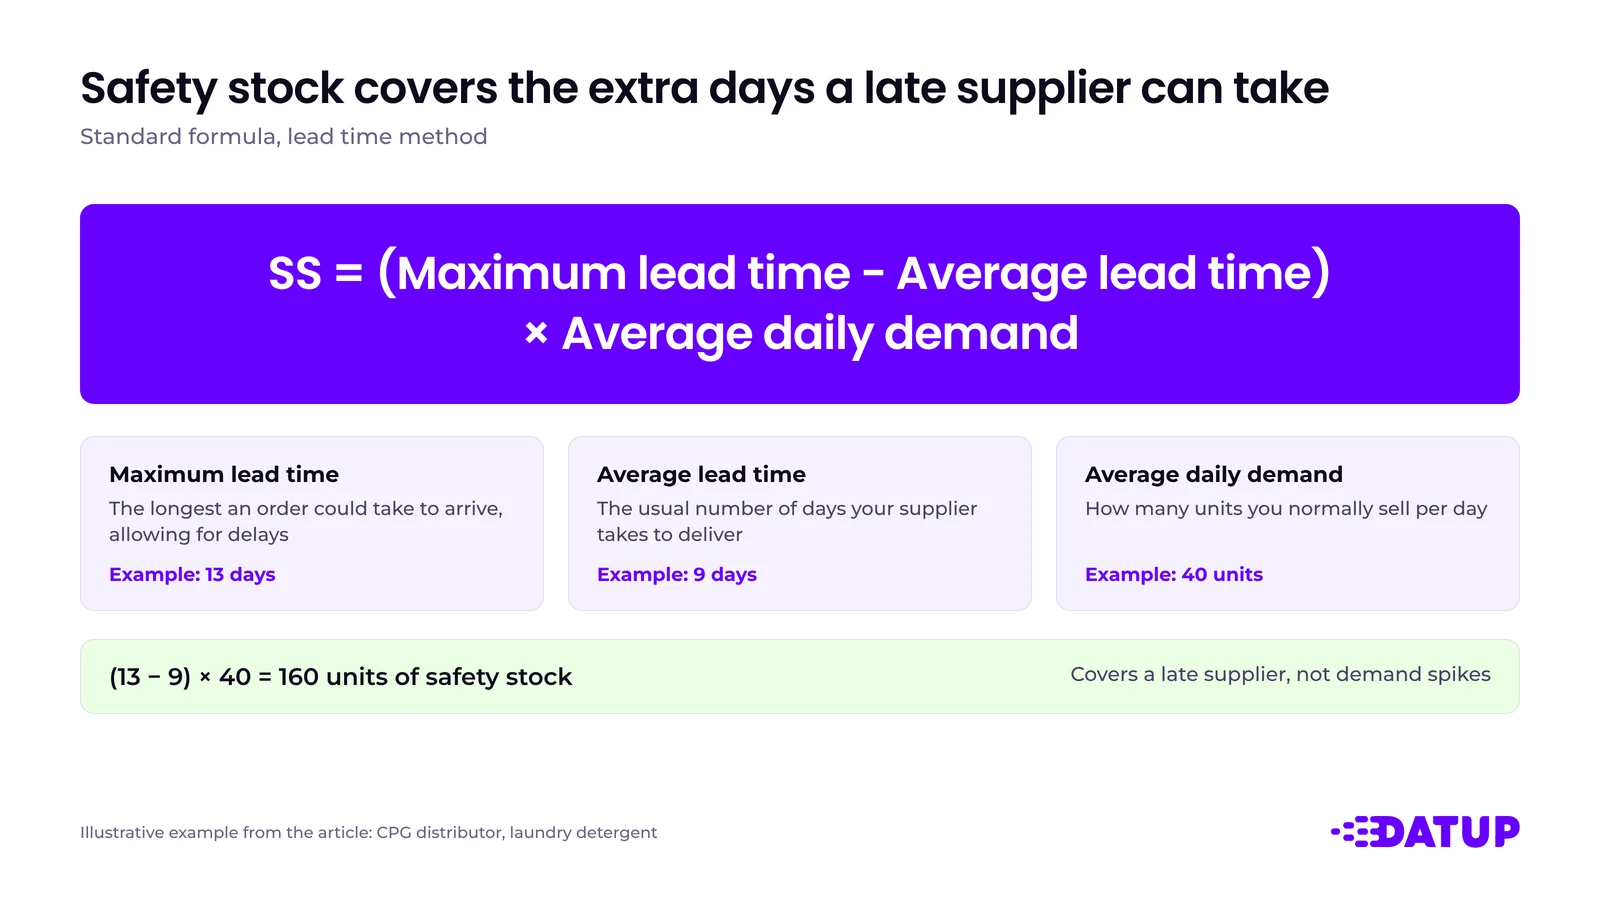
Standard safety stock formula:
Safety stock (SS) = (Maximum lead time − Average lead time) × Average daily demand
Where:
In other words: you multiply the difference between the maximum and the average lead time by the average daily demand. The result is the buffer you need so you don't run out of product if the supplier is late.
This approach is especially useful if your lead times vary often or if you handle products that are highly critical to your operation. And if you automate this calculation with a tool like Datup, you can see it in real time based on your demand variability and your suppliers' performance.
The lead time formula is a good starting point, but it's not the only one. The right one depends on what varies in your operation: demand, lead time or both.
SS = (Max daily demand × Max lead time) − (Average daily demand × Average lead time)
It compares what you'd consume in a worst-case scenario with what you consume in a normal one. The difference is your buffer. Most guides present it as the standard formula. It's easy to calculate, but it comes out high, because it combines two extremes that rarely happen at the same time.
SS = Z × σd × √LT
This is where you decide how much risk you accept. The cycle service level is the percentage of replenishment cycles in which you don't run out of stock. A 95% service level means that in about 5 out of every 100 orders, you could run out before the next delivery arrives.
The relationship isn't linear: each extra point of service costs more inventory than the one before. That's why it makes sense to set different service levels by product criticality, not one level for your whole portfolio.
SS = Z × √(LT × σd² + (d × σLT)²)
It adds up both sources of uncertainty: how much demand varies and how much your supplier varies. It's the most complete of the four, as long as one variation doesn't depend on the other.
One limit applies to all of them: they assume demand behaves similarly from day to day. If a product goes weeks without selling and then spikes, or if it's new and has no history, you need a different kind of analysis.
Imagine a CPG distributor that wants to calculate safety stock for a laundry detergent at its distribution center. The figures are illustrative.
1. Lead time method: (13 − 9) × 40 = 160 units
2. Max and average method: (62 × 13) − (40 × 9) = 806 − 360 = 446 units
3. Service level method: 1.65 × 12 × √9 = 1.65 × 12 × 3 = 59.4 → 60 units
4. Combined method:
Why are the results so different? Because each one covers a different risk:
In this case, supplier variation weighs almost five times more than demand variation (6,400 vs. 1,296). Before raising the buffer, work with your supplier to make deliveries more consistent.
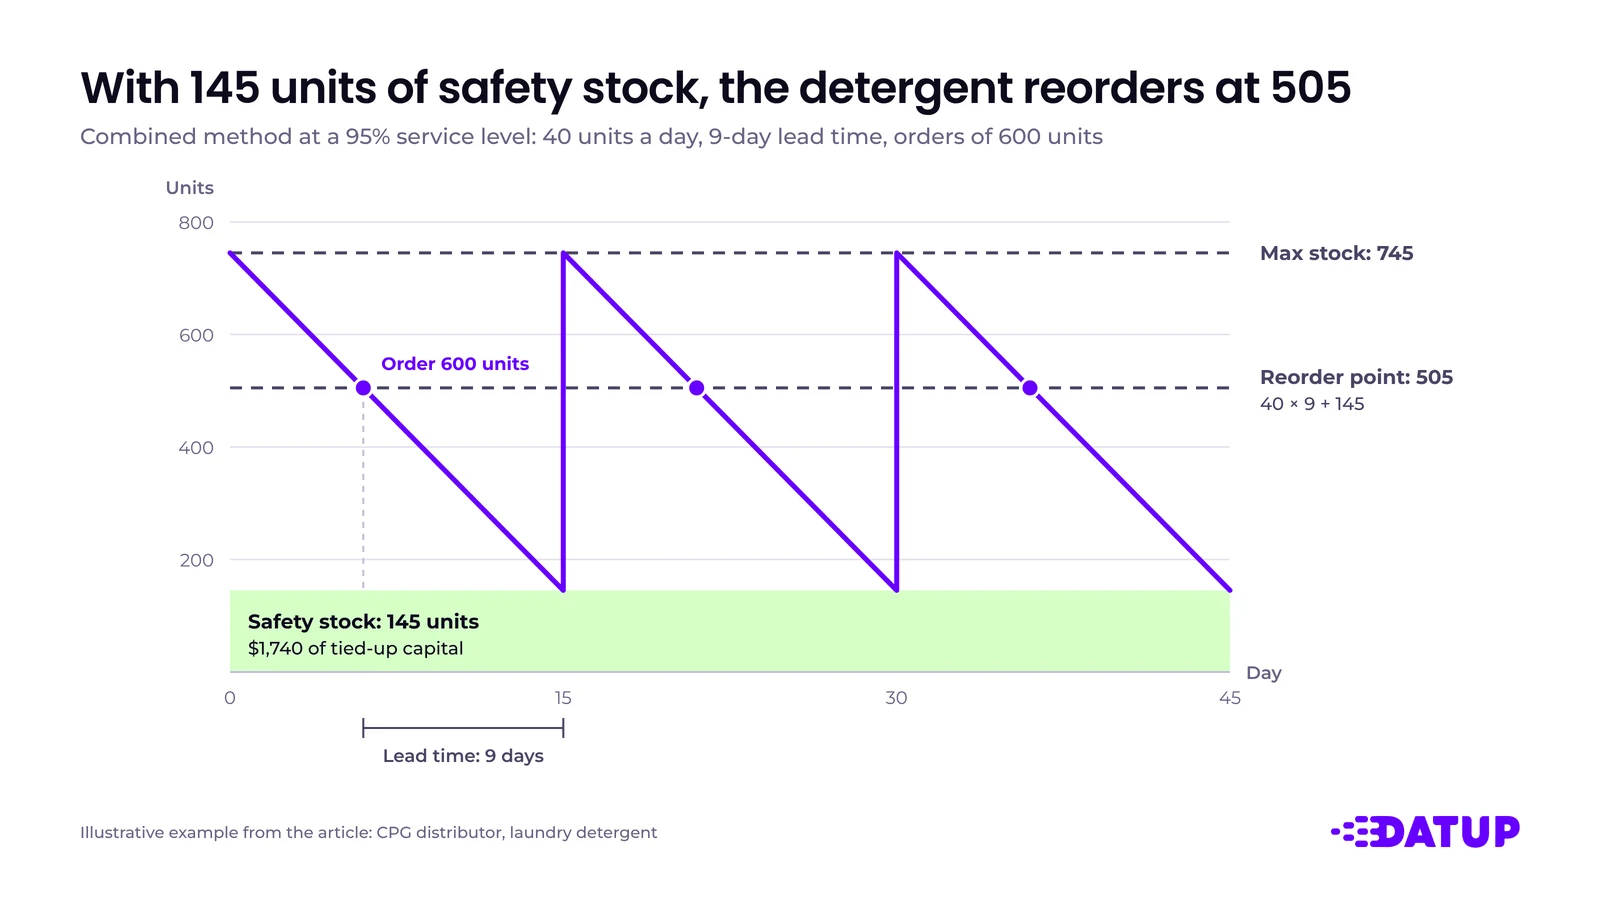
With the combined method, the reorder point is 40 × 9 + 145 = 505 units: when inventory drops below that level, you place the order. Our guide to the reorder point formula walks through that calculation step by step.
You don't need software for your first calculation. With your daily sales history and the receipt dates of your last orders, you can build all four formulas in one sheet:
Column B holds your sales for each day and column C the number of days each order took to arrive. Google Sheets uses the same function names as Excel.
Watch out for two things: count days with no sales as 0, and don't treat stockout days as demand, because those low sales don't show what your customers wanted to buy.
A spreadsheet works well for a handful of SKUs. If your company has more than $1 million in annual revenue, manages more than 500 SKUs or recalculates its buffer by hand every week, a platform like Datup does it for every product and location, with up-to-date data from your ERP.
In inventory planning, three key concepts work together:
Visually, safety stock acts as a safety net. When inventory reaches that point, it's a clear signal to replenish. That way, the operation is far less likely to run out of product, even if the supplier's lead time stretches or demand grows more than expected. You can set up low-stock alerts in free inventory management software, as long as the threshold reflects your reorder point and not a fixed number.
The more unpredictable a product's demand, the higher its safety stock needs to be to avoid stockouts. This applies especially to seasonal products or products with erratic demand.
If your suppliers' lead times are long or inconsistent, you need a bigger cushion to make up for those delays. Lead time is key to deciding when to order, but also how much to keep in reserve.
Not all products have the same impact on the business. Those that are essential to the operation, or that drive most of your sales, need higher safety stock to stay available.
Good safety stock lets you fulfill orders on time, improve the customer experience and strengthen your brand's reliability. In highly competitive markets, that makes a difference.
Every stockout is a sale that doesn't happen. If it happens often, it stops being an exception and becomes a steady revenue leak. Safety stock acts as a cushion that fills those gaps and keeps the business flowing, even during unexpected spikes.
Without buffer stock, every mismatch becomes an emergency. That means improvised purchase orders, suppliers under pressure and higher logistics costs. With a well-calculated buffer, you can operate more predictably without depending on last-minute decisions.
A well-defined minimum inventory level improves coordination between purchasing, production and logistics. It speeds up decisions, reduces friction between teams and lets you meet commercial commitments without sacrificing efficiency.
Not every product needs it as a priority. To manage your inventory well, you need to decide carefully which products really need safety stock. It's not about filling the warehouse, but about protecting what has the most impact.
Here's a quick checklist to see whether your most critical products are covered against the unexpected:
If you answered ✔️ to two or more, you should consider safety stock.
It gives you backup against uncertainty, operational stability and better service levels without relying on intuition.
Keeping safety stock for the most important products in your portfolio is a key part of your company's sustainable growth. Ignoring it can lead to invisible losses that hit your revenue without you noticing.
If you haven't yet, now is the time to review your safety stock and rely on tools that automate this process.
With Datup, you can calculate the safety stock of every product automatically, without error-prone spreadsheets or manual work. Less operational load, faster decisions and a more strategic focus for your team.
Not always. Some companies use minimum stock to mean the safety buffer, and others use it for the level at which they place an order, which is really the reorder point. Before comparing figures across teams or systems, confirm what the term means in each one. If minimum stock in your ERP is the ordering level, it's calculated as demand during lead time plus safety stock: 505 units in the detergent example.
Maximum stock level = Safety stock + Order quantity
It's the highest inventory you should have, right when an order arrives. If the distributor in the example orders 600 units each time, its maximum stock level is 145 + 600 = 745 units. If you go over it often, you're overbuying. You can size each order with the economic order quantity (EOQ) model.
It's the level below which you can no longer cover demand, not even with a rush order. There's no single definition: many companies use it as a synonym for safety stock. If your team uses it as an urgency alert, calculate it as daily demand times the number of days a rush order takes. For the detergent, with a 3-day rush order: 40 × 3 = 120 units.
The reorder point includes safety stock. It's calculated as demand during lead time plus the buffer: 40 × 9 + 145 = 505 units in the example. When you reach that level you place the order, and the buffer covers the unexpected while it arrives. See the step-by-step reorder point formula.
In practice, many companies use them as synonyms. When they're distinguished, safety stock covers normal variation in demand and lead time, and emergency stock is an extra reserve for rare events: a supplier shutdown, a transportation strike or a health alert. Emergency stock doesn't come from a formula; you decide it based on the risk and on what running out would cost.
In practice, yes: the two terms are used as synonyms. Both describe extra inventory that protects you from stockouts when demand or lead time doesn't go as planned. Some teams use buffer stock more broadly, for example for inventory built up ahead of a promotion or a planned shutdown. If your team makes that distinction, agree on it before comparing figures.
The advantage is protection; the disadvantage is cost. Safety stock keeps you selling when demand spikes or a supplier is late, and it cuts down on rush orders. The trade-off is tied-up capital and carrying costs: in the detergent example, the max and average method ties up $5,352, compared with $1,740 for the combined method. Too much buffer can also turn into dead stock if demand drops. That's why it pays to choose the formula that matches your real risk and to review it regularly.

Laura Ramírez is a business and operational planning supply chain strategist with more than 15 years of experience helping companies make better decisions based on data.