
🇺🇸

Problems with cash flow, working capital, and service levels can be rooted in poor demand planning or without data-based support. This generates significant financial impacts, where key components such as supply of supplies, demand forecasting and prior planning are not taken into consideration.
In this guide, we present in a concise way all the points you need to know to make a demand planning in a strategic, collaborative and successful way, and above all, based on reliable data.
Demand planning in the supply chain is the process of designing and managing the inputs that will be needed in the future to meet demand and meet business objectives.
It is often said that demand planning or demand planning is the heart of the supply chain, without proper planning, the rest of the links in the chain may not be the most efficient and generate problems.
When starting the planning process, many questions may arise in the middle of the operation. To be a demand planner is to work in a context of high uncertainty, so It's normal to have questions and problems new ones every week.
Some of the most common questions at the beginning are the following:
In the hustle and bustle of daily operations, we ignore the answers to these questions, but from our experience we recommend understand what is behind everyday problems before they turn into a snowball that they end up in oversupplies or stock failures. Keep reading to be able to successfully answer these questions in your planning process.
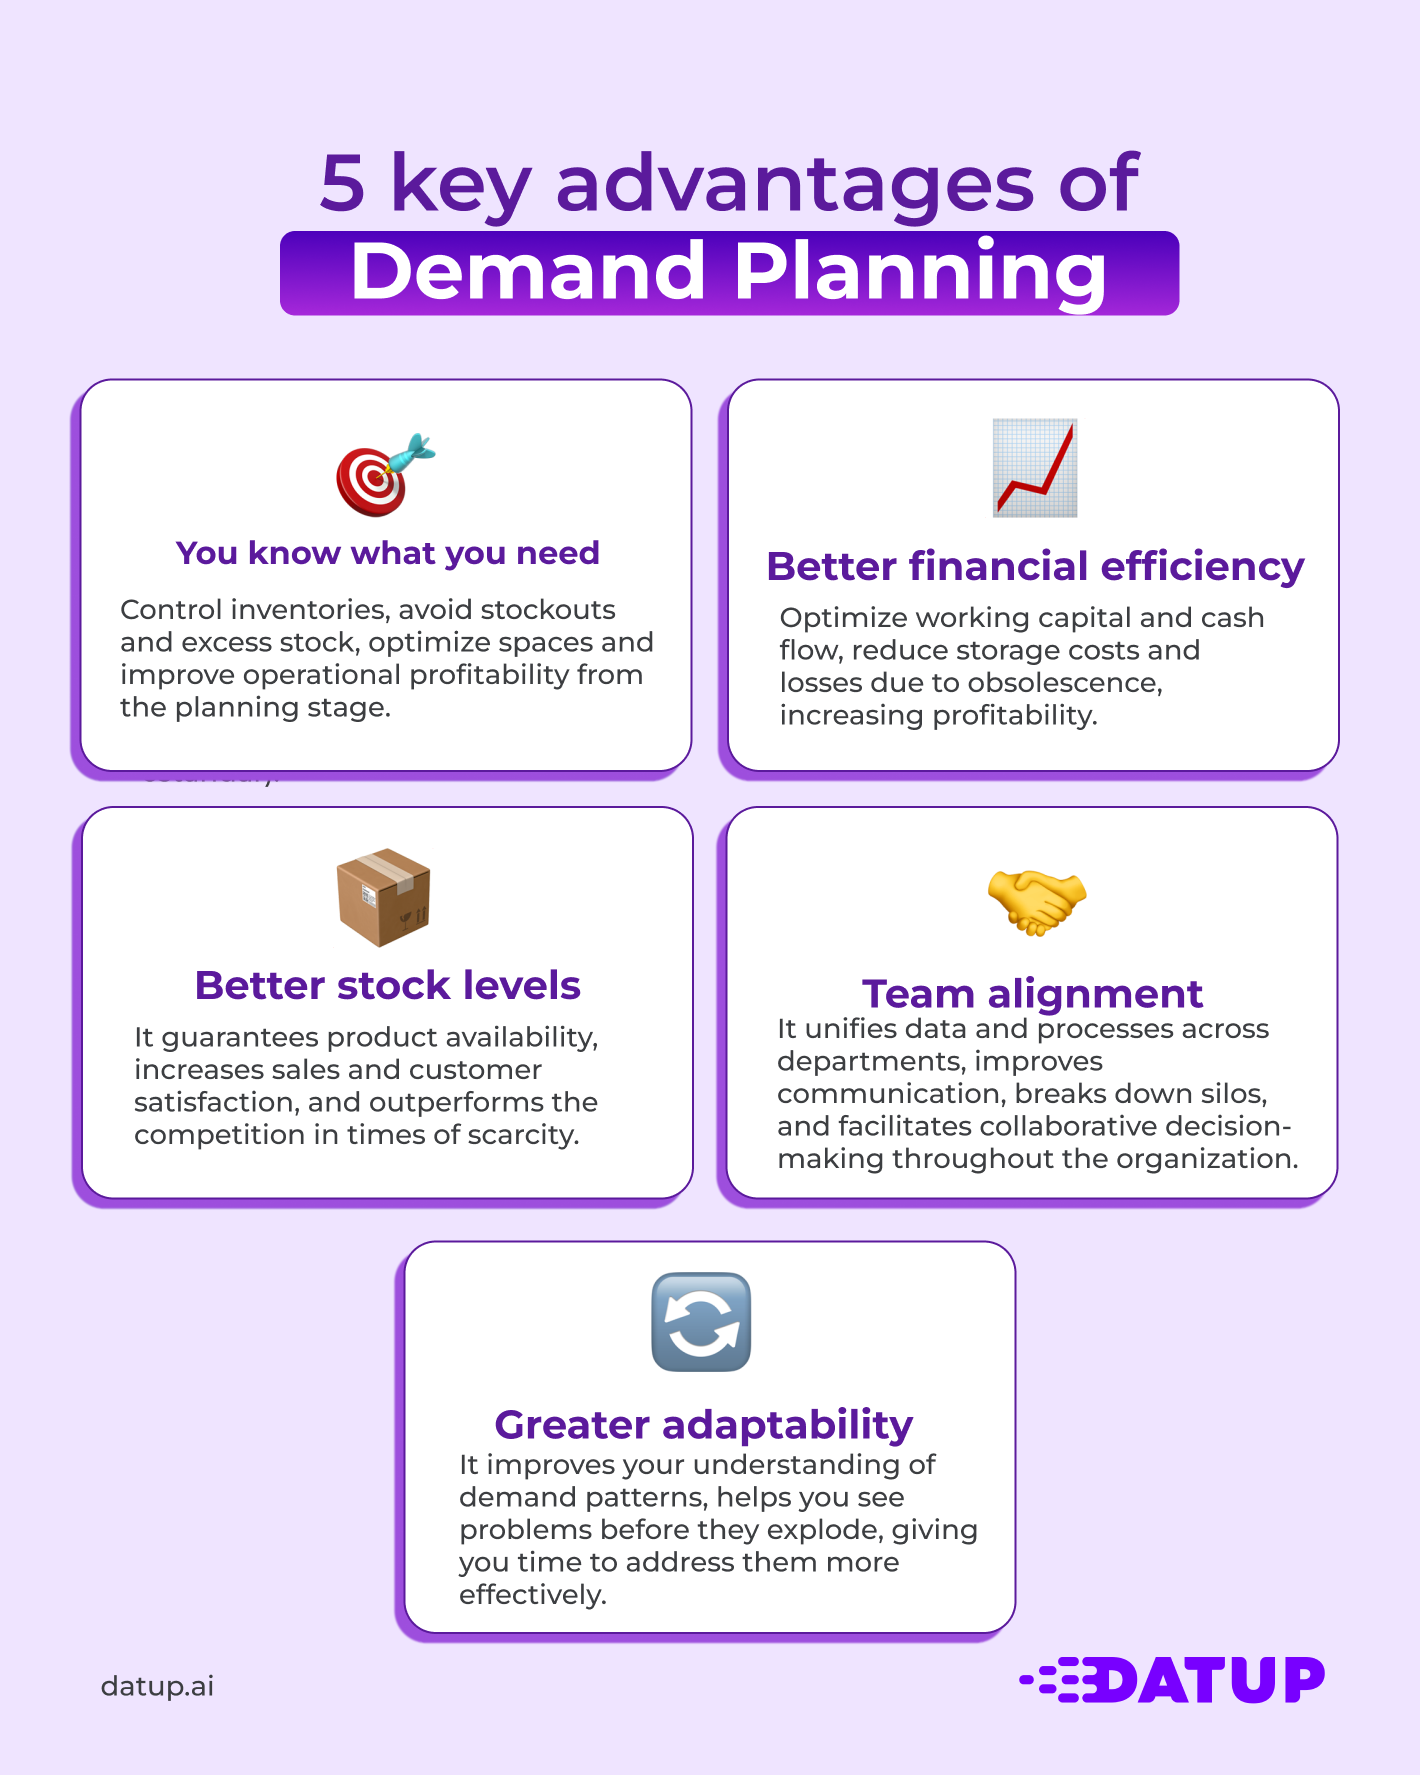
Efficient demand planning can control the inventory level, maintain the optimal level of safety stock, and plan in detail with the knowledge of suppliers, lead times, product seasonalities and upcoming promotions or events.
This helps to reduce excess inventory paralyzed in warehouses or warehouses and avoid stock failure, improving customer service levels, speed of return on investment, operational optimization of space at storage points and reduction of fixed capital.
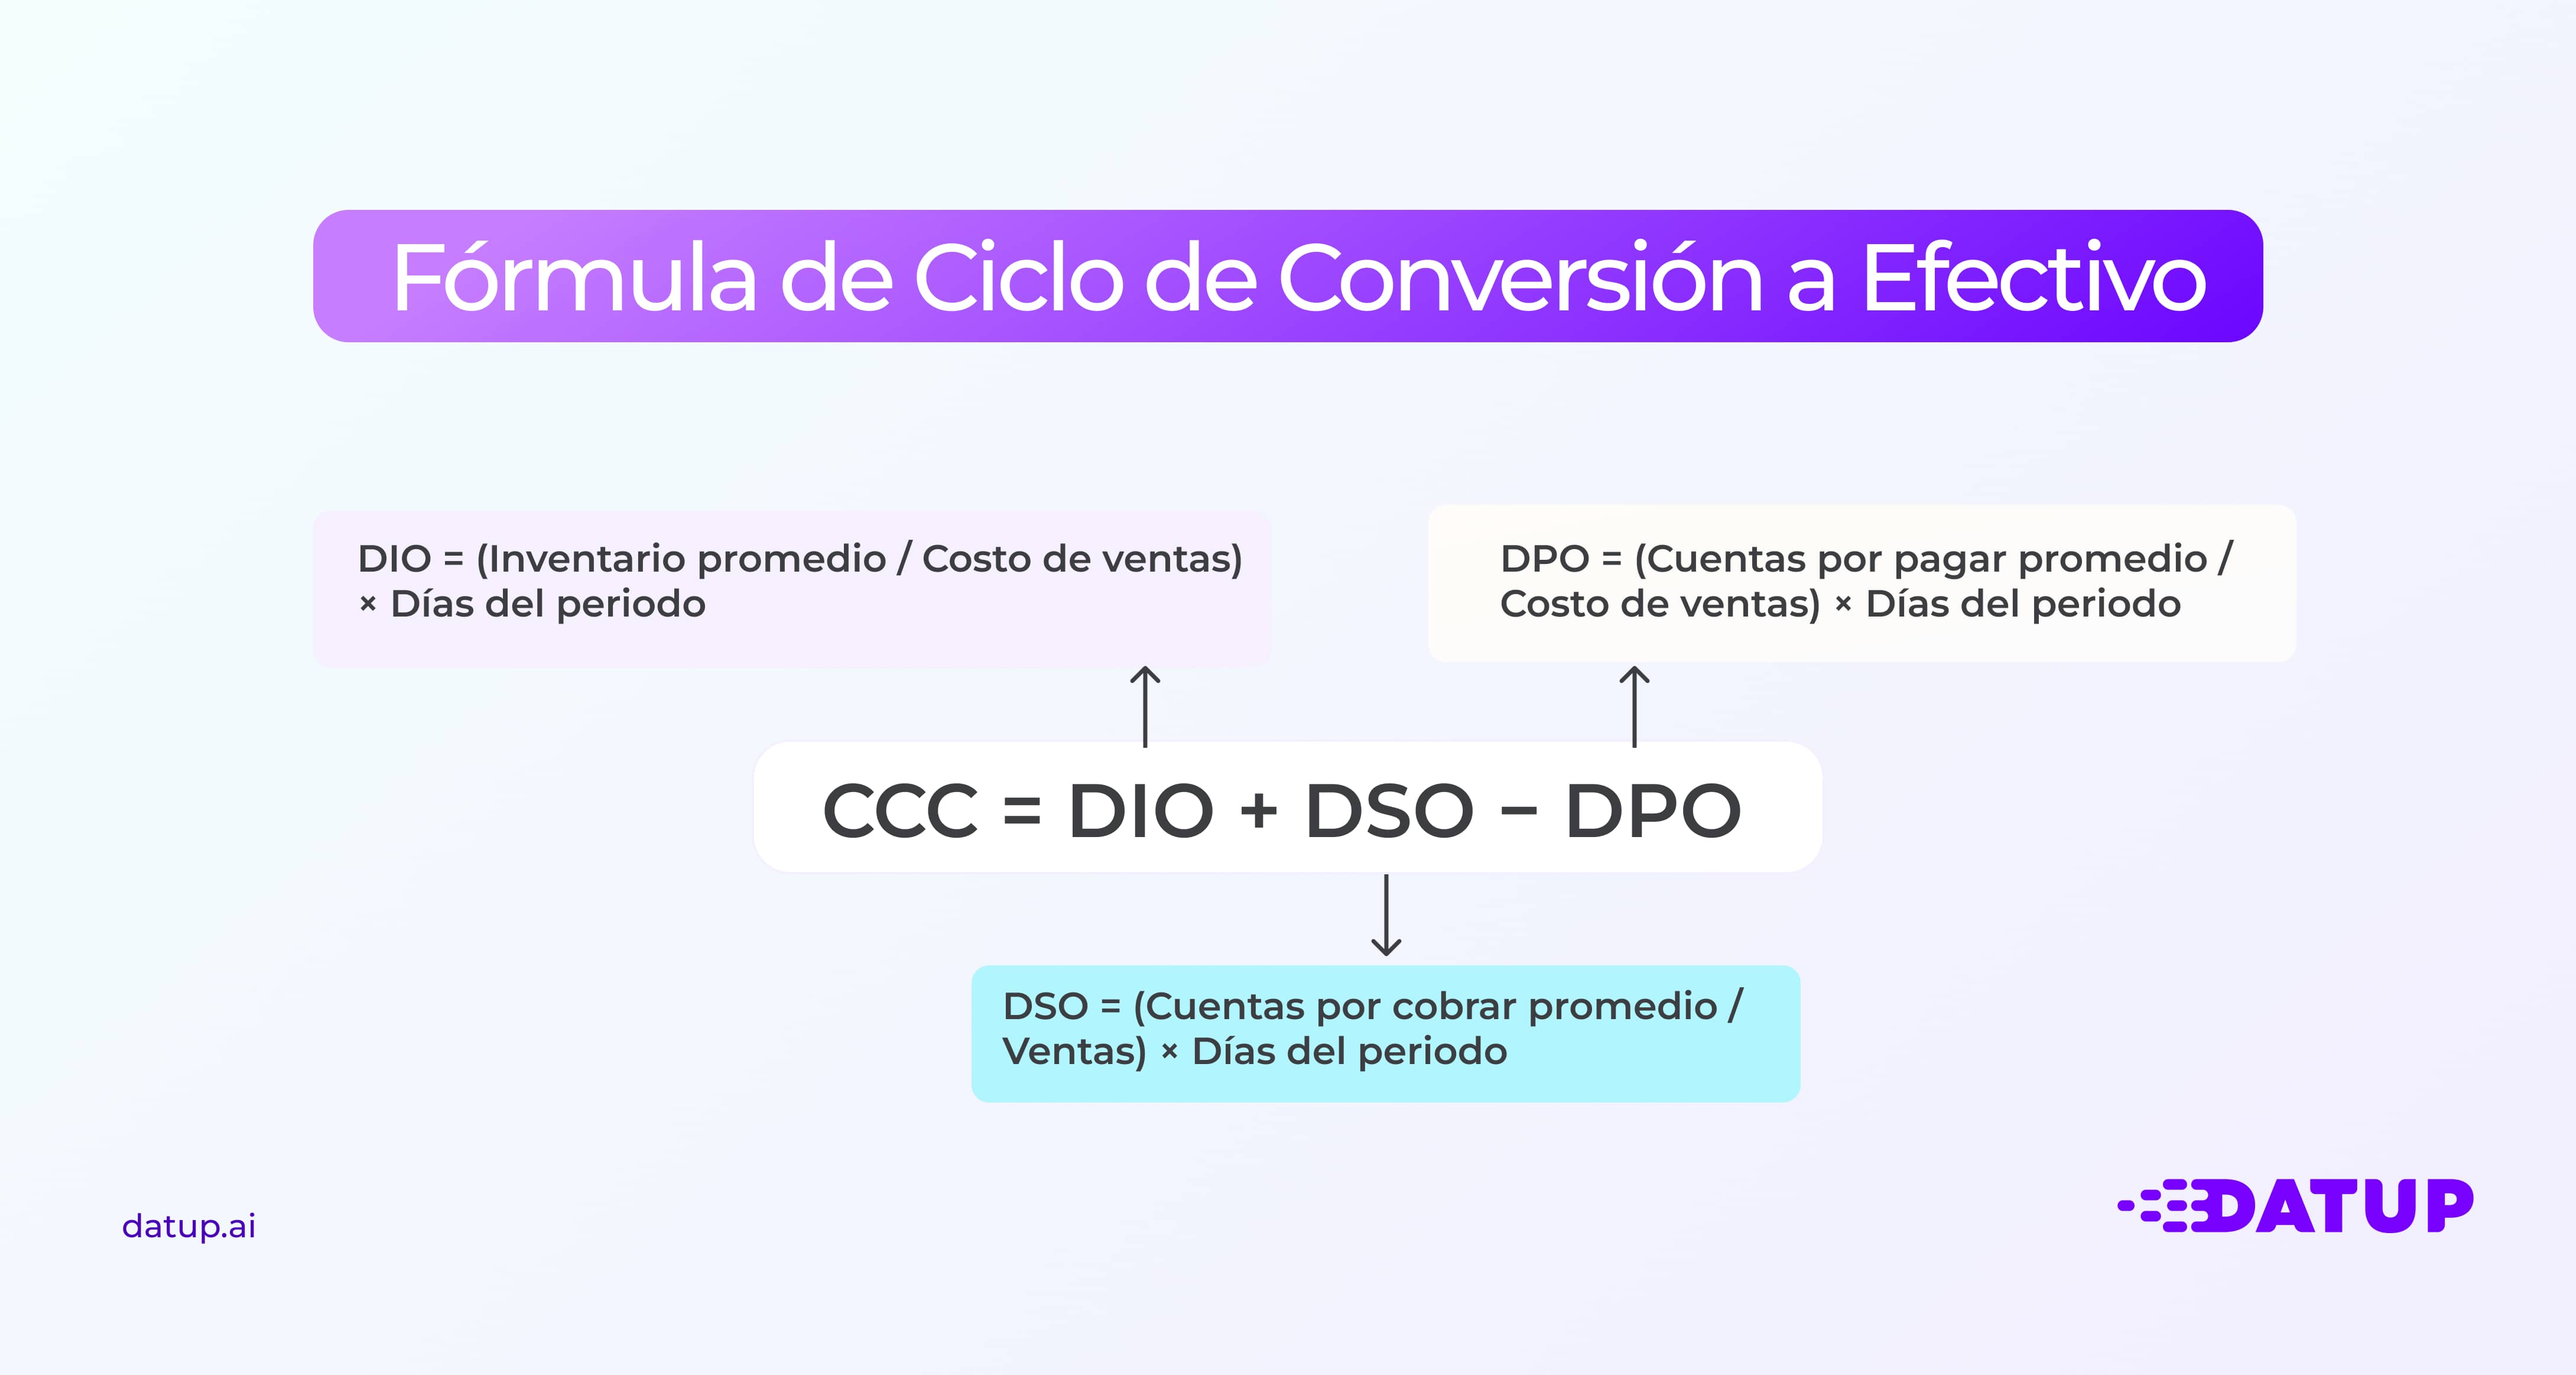
From a financial point of view, the results of the planning process are reflected in an optimization of working capital and cash flow, reduction of financial costs by optimizing storage costs, lower losses due to obsolescence or waste, and higher margins due to inventory management focused on profitability.
You guarantee the availability of your products when and where they are needed, increased turnover due to reduced stock failures, improved customer confidence and satisfaction, and you remain available when your competition fails, capturing sales that others lose due to shortages.
It facilitates decision-making between multiple teams involved (operations, sales, finance), all managing a single data source and planning process, improves communication and breaks silos between areas.
It improves knowledge of demand patterns, helps to see problems before they explode, giving you time to solve them more consciously. This allows you to react faster when the market changes, adjust what you produce or buy according to lead times and supplier response, take advantage of opportunities when they appear and better protect yourself when there is a drop due to external events.
It's easier to forecast demand for a product family than for an individual SKU. Aggregation reduces variability.
Before starting any planning exercise, you should be absolutely clear about what you want to achieve. Not all objectives are compatible with each other, and you need to prioritize.
Define your primary purpose:
More important than any software is to have a clear process and a defined schedule. Everyone involved should know:
For example: “On the 5th of each month, the Data team delivers the statistical forecast. From the 6th to the 10th, Sales and Marketing add their vision. On the 12th, we met to reach a consensus.” Without these rules, the process becomes chaotic.
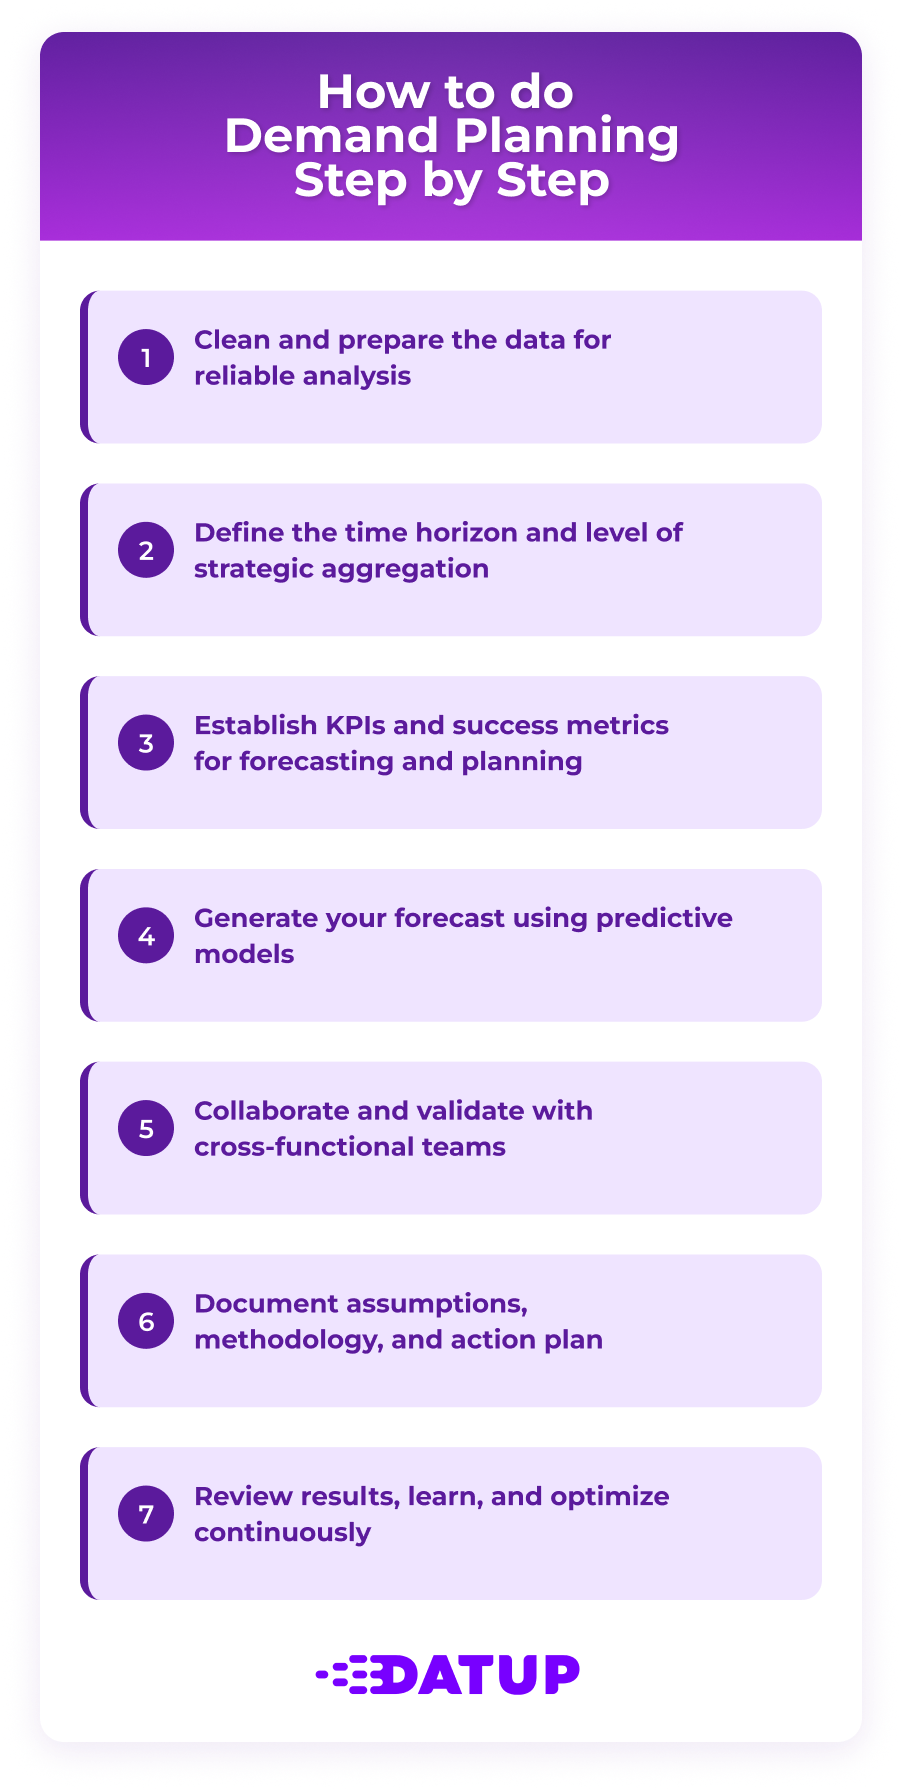
Before you start making numbers, you need to make sure you have a solid foundation. Here you review three key things: that your data works, that you know what you want to achieve, and that you are clear about how you are going to measure if you are doing it right or wrong.
Your forecast will be only as good as the data you use. If you put garbage in, garbage comes out. It's that simple.
Get real demand, not just sales
Sales history doesn't always tell you the whole story. If you can, get point of sale (sell-out) data, which shows you what the end consumer is actually buying. That data tells you what the market really wants, not just what your distributors asked of you.
If you only have data on what you dispatched (sell-in), be careful: there may be distortions there. Sometimes distributors ask for more or less for their own reasons that have nothing to do with actual demand.
Clear your data history
Historical data is rarely clean. You have to identify everything that will not be repeated the same in the future, so that you are not fooled by the model:
There is no one forecast that works for everything. And forecasting by SKU isn't automatically “better”. You have to understand what you need the forecast for.
Hierarchy (or aggregation level)
Do you need to view product by product (SKU), or does it work for you per family? By region or by customer? Here's a secret: aggregated forecasts are always more accurate than super-detailed forecasts.
Planning the total production of a plant is very different from deciding how many units to replace in a specific store. Each level needs its own version of the forecast.

Time Horizon
How you'll use the forecast tells you how far you need to see:
From day one you have to know how you are going to measure if you are doing it right.
Accuracy metrics
These tell you how close you were to what actually happened:
Once you have the basics, the planning cycle becomes something repeatable and orderly.
This is your objective starting point, using only your clean history.
Choose the right method
The model you use depends on the patterns you see in your data:
Use tools that make your life easier
They exist demand planning software which does the calculations automatically, adapts to the nature of your products and saves you a lot of time. So you can focus on the strategic part of the process instead of struggling with formulas.
A statistical model only knows the past. He has no idea what you plan to do in the future. This meeting is to “enrich” your prediction based on what other teams know.
Get the right people together
You need Sales, Marketing, Finance and Product people at the table.
Ask the right questions
Don't ask them “how much do you think we'll sell?” That doesn't work. Instead, guide the conversation:
The goal is to come up with a single number that everyone agrees on and that the entire company will use.
Document each setting
Every time you change the statistical forecast, write down why. For example: “We added 200 units to Product X for the Mother's Day campaign.” This creates responsibility and then helps you learn.
The S&OP meeting
This is the meeting where it is decided. Here they review the adjusted forecasts, discuss the imbalances between what is needed and what they can produce, and make the final decision. The result is the Official Demand Plan: the only version of the truth for the entire company.
The process doesn't end when you publish the plan. Real improvement begins at the end of the cycle, when you compare what you planned against what actually happened.
At the end of the period, grab the actual data and compare it to your consensus forecast.
Calculate your metrics
Use the metrics you defined at the beginning (WMAPE, BIAS) to see how well you did.
Put together a simple report
A graph where you see the line of your forecast against the line of real demand is super clear and tells you everything you need to know.
This is one of the most valuable things you can do. Check if your errors are random or if there is a pattern.
Were we very optimistic? If you always forecast more than you sell, you have a positive bias. This leaves you with plenty of inventory.
Were we too conservative? If you always forecast less than what you're selling, you have a negative bias. This causes you to lose sales and you run out of product.
The point to measure is not to look for culprits, it's to learn. Organize a short meeting to discuss why the biggest mistakes failed.
Root cause analysis
Why are we wrong? Didn't the Marketing promo pull as expected? Were sales very optimistic with a new customer? Did a competitor make an offer that we didn't see coming?
Adjust the process
Use what you learned to improve the next cycle. For example, if Marketing always exaggerates the impact of their campaigns, you can start to adjust their numbers downward until their estimates improve.
Companies invest time and resources in refining product forecasts with little financial impact, while neglecting those SKUs where incremental improvement could generate significant savings or substantial increases in profitability.
This error stems from a lack of ABC/XYZ analysis of the portfolio, ignorance of the financial impact of each product category, and a culture of indiscriminate perfectionism that assumes that all SKUs deserve the same level of attention.
This has the consequences that the team spend more time on unimportant products than on strategic ones.
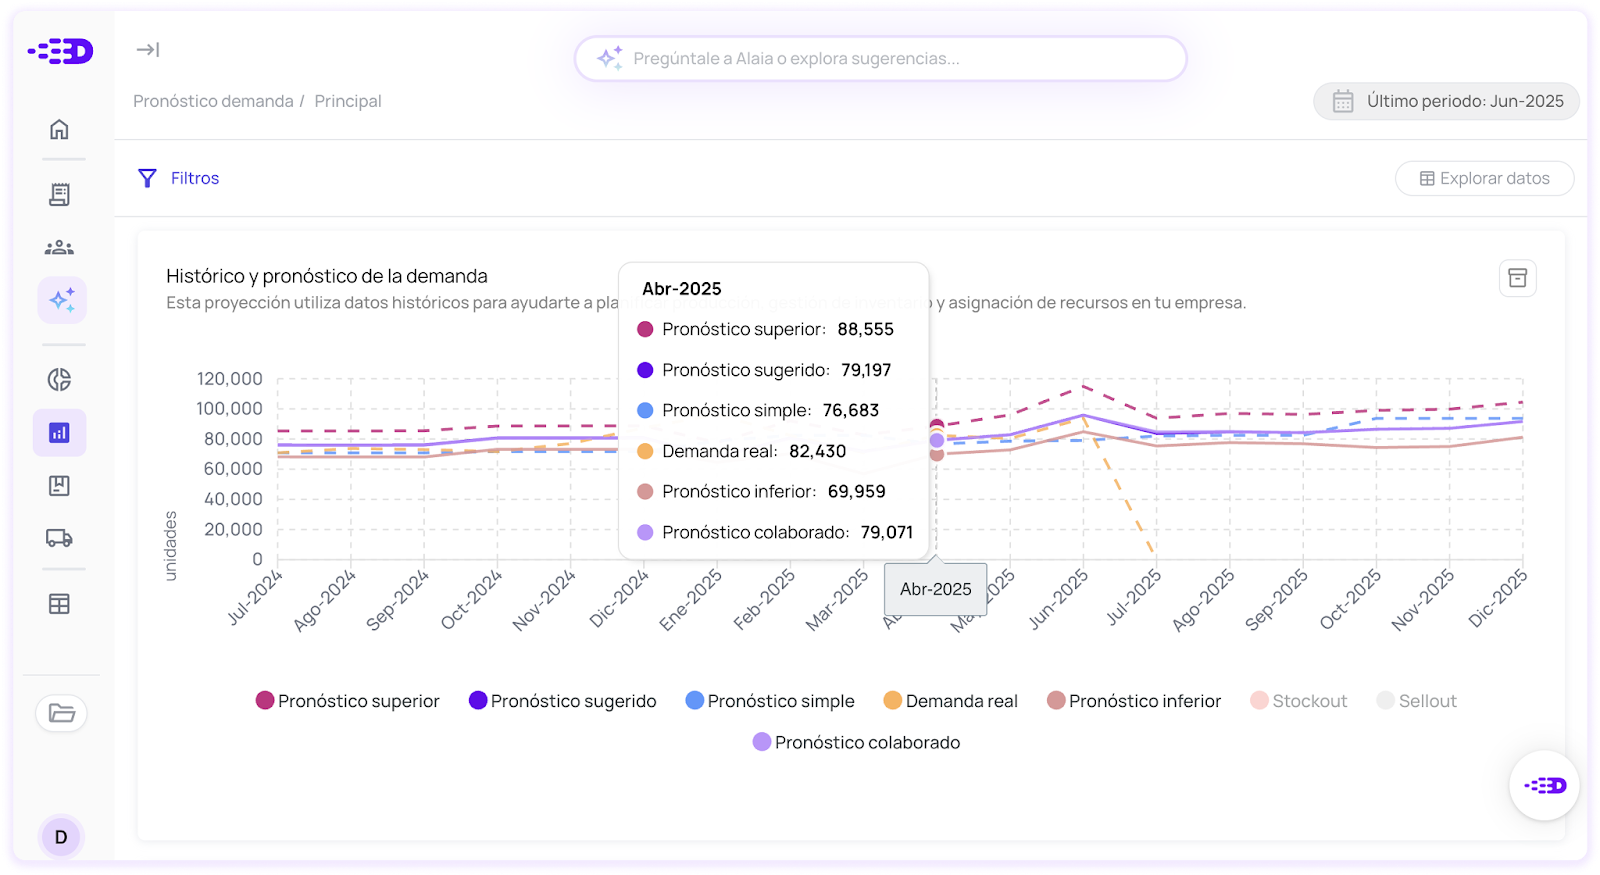
Having a “perfect” forecast is an illusion. The goal is not to predict the future, but to reduce uncertainty in order to make better decisions. That's why you should work with forecast ranges (low, suggested, and high) instead of a single number.
Rather than looking for 100% accuracy, we need to measure error and bias, know how far we deviate and if we fall above or below. It also helps to validate horizons (short, medium) and not always go to extreme detail (SKU/Category/store), because the more disaggregation there is more uncertainty.
The forecast is useful when connected to the operation, using the “suggested” scenario as a starting point, adjusting it with the commercial team and covering the uncertainty with more intelligent security stock, hedging and replacement/distribution.
Let's not get obsessed with seeking perfection, we're looking for better decisions. With ranges, simple error measurement and inventory levers, we protect service level, working capital and profitability, even as demand changes.
One of the most common errors in planning processes is to work on the forecast in isolation, without aligning with the different teams that are part of the business.
When there is no communication between sales, operations, purchases and finance, the forecast loses context: the numbers may be correct, but the decisions may not.
Talking with the teams allows us to combine data with the reality of the market, such as promotions, price changes, launches or logistical problems that the model alone does not detect. In addition, it generates agreements and commitments on a single plan, instead of multiple versions that generate confusion.
The true value of the forecast is not only in the number, but in the consensus it causes. A good collaborative process turns planning into a shared tool for improving service, optimizing inventories and aligning objectives between areas.
Ignoring exceptions is one of the errors that most distorts a forecast.
Atypical sales due to promotions, events, price changes or extraordinary situations do not represent real demand behavior, and if included without adjustment, they can cause the model to “learn” patterns that will never be repeated.
Taking into account exceptions does not mean deleting them, but rather labeling and analyzing them. In this way, the models can differentiate between a normal peak season and an exceptional sale. This makes it possible to adjust the historical base and generate more stable and reliable projections.
A good prognosis doesn't just look at the numbers, it understands the causes behind them. Recognizing exceptions helps maintain the balance between accuracy and business knowledge, avoiding wrong decisions due to misinterpreted data.
Demand planning has changed completely in recent years.
Before, it was based on spreadsheets, intuition, and simple statistical models that only looked at the past. Today, with artificial intelligence, planning has become more dynamic, predictive and collaborative.
Today's models no longer just project a number: they learn from historical patterns, detect changes in market behavior and generate scenarios that help to anticipate. In addition, they can combine internal data (sales, inventories, orders) with external factors such as weather, prices, or consumer trends.
This evolution allows us to move from reacting to changes, to anticipating them and making decisions in real time. AI doesn't replace the glider, it empowers it, frees it from operational time, improves accuracy and provides a clearer vision to align business, operational and financial strategy.
The new demand planning with AI is not about better forecasting, but about planning with intelligence, connecting data, people and technology to build more agile and profitable supply chains.
It's not about guessing the future, but about reducing uncertainty and making more informed decisions.
It involves commercial, operations, finance and purchasing. The best planning comes from the exchange between areas.
Don't ignore unusual events: analyze them, classify them and use them to better understand your business.
Use the data, but also the criteria
AI and models help, but human experience interprets context. The combination of both creates real value.
Monitor your accuracy and bias. What's important isn't just the result, but how you evolve with each cycle.
Align your projections with inventories, purchases and distribution. Success is not in the number, but in the decisions it drives.
https://www.oreilly.com/library/view/demand-driven-forecasting-a/9781118735572/
Felipe has specialized in the application of artificial intelligence to optimize supply chains, helping companies to predict demand, manage inventories and determine the ideal times to buy raw materials.

.jpg)


.png)