
🇺🇸
40% of a Demand Planner's time is spent trying to explain pWhy did the previous month's forecast fail. Meanwhile, inventory remains misaligned, stockouts are piling up and buying decisions are made with data from two weeks ago.
The question isn't whether your data can predict the future of your Supply Chain. The question is how much money you're leaving on the table while still relying solely on Excel and your intuition.
Predictive analytics in Supply Chain combines historical data, machine learning and real-time signals to estimate the likelihood of future events. It tells you what is likely to happen, with what level of confidence, and what to do about it before it impacts your operation.
Recent studies highlight that the predictive analytics market exceeds 18 billion dollars in 2024, with an annual growth rate above 25— 28%, reinforced by adoption in supply chain and logistics.
In Latin America, 70.07% of Supply Chain professionals has stated that predictive and prescriptive analytics is its top priority for technological implementation in 2026.
Here we explain exactly how it works, what technical components you need, which use cases generate the most ROI, and how to get started without turning this into a three-year project that never leaves the pilot phase.
It is the systematic use of historical data, real-time data, advanced statistical techniques and machine learning algorithms for estimate the likelihood of future events along your Supply Chain. Its goal is to make proactive decisions about demand, inventory, supply, transportation, and level of service.
Unlike descriptive reporting (what happened last week) or diagnostic analysis (why sales plummeted in March), predictive analytics focuses on What is likely to happen and with what level of confidence, enabling early adjustments before problems explode in your face.
Understanding this difference is critical because many companies believe they are doing predictive analytics when in reality they're just looking at beautiful dashboards from last month.
Predictive analytics is the bridge between knowing what happened and deciding what to do. Without it, you're flying blind.
How it combines historical data, machine learning and real-time data
Power comes from combining three types of inputs:
Structured historical data: Past sales by SKU, channel, region and customer. Inventory movements. Purchase orders and lead times observed. Quality issues. Historical promotions and prices. This is your base pattern.
Real-time data: Today's sales, current inventory turnover, GPS position of shipments, cold chain temperature sensors, traffic on logistics routes. They allow you to detect early deviations and recalibrate predictions before it's too late.
External variables: Climate, macroeconomic indicators (inflation, exchange rate), holiday schedule, Google search trends, social media data. These signs explain why the historic pattern may not be repeated: a heat wave increases demand for beverages, a port strike impacts import times.
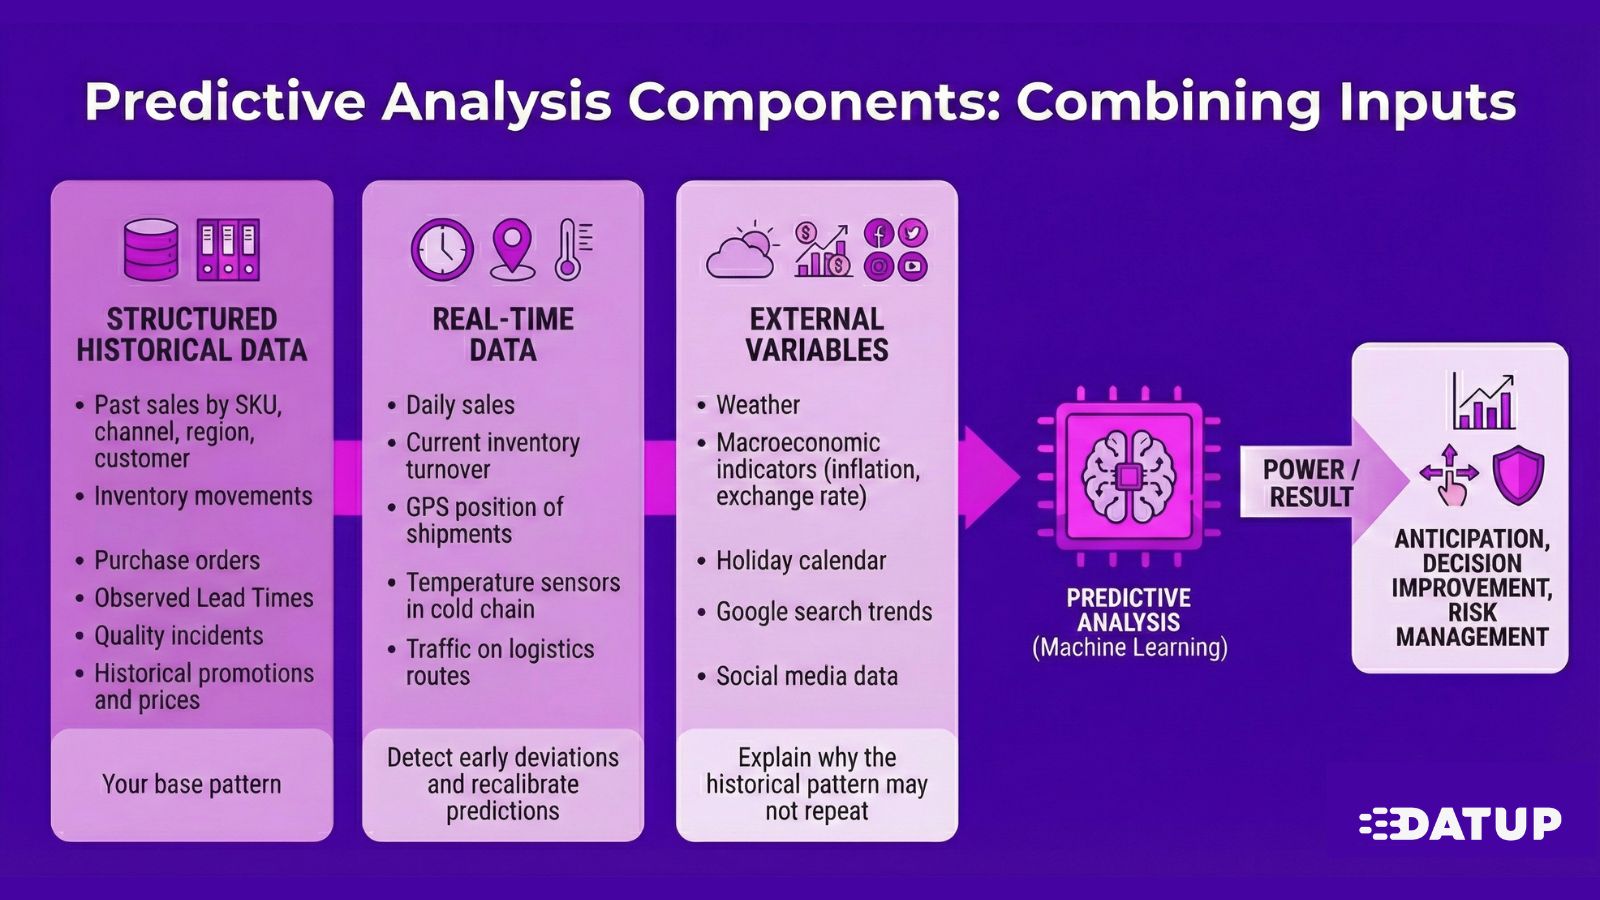
Machine learning algorithms process these three types of data simultaneously, detecting nonlinear patterns and correlations that traditional analysis doesn't capture.
The practical difference:
A traditional Forecast model tells you that you've historically sold 1,000 units per week.
A predictive model with ML tells you that next week you're going to sell 1,340 because it detected 8°C warmer weather, a long holiday and your competitor's stockouts in three regions.
Those 340 units are the difference between meeting your service level or not.
The ultimate goal is not to have sophisticated models. It's about making better decisions before problems impact your P&L.
This translates into concrete actions:
Predictive analytics doesn't eliminate uncertainty. It gives you early visibility into the likely range of scenarios and allows you to prepare rather than react.
Implementing predictive analytics isn't about installing software and expecting magic. It's an iterative process with six steps that connect data, models and operational decisions.
It all starts here. If your data is fragmented, incomplete, or full of errors, your predictions will be garbage wrapped in beautiful equations.
You need to consolidate information from your core systems: ERP (sales orders, purchase orders, production, inventory movements), WMS (inputs, outputs, locations, turnover), TMS (routes, delivery times), CRM (customer behavior). Also IoT sensors if you have them: vehicle GPS, temperature in cold rooms, filling levels.
The real pain:
We have seen companies with five different ERPs, sales data in spreadsheets sent by email, and supplier information in PDFs. If this is your case, data collection isn't a minor technical step, it's 60% of the project effort.
Raw data is a disaster. Duplicate SKUs with different codes, customers with three different names, dates in incompatible formats, inventory movements that don't match purchase orders.
💡 The Golden Rule: If you spend less than 50% of your project time preparing data, your models are likely to fail. Serious data scientists spend 70-80% of their time cleaning data. It's not sexy, but it's where you win or lose the game.
This is where machine learning algorithms come in. But before jumping into complex models, you need to clearly define what you are trying to predict and with what time horizon.
For Demand Forecasting, the most used models:
Training divides your data into training (70-80%), validation (10-15%) and test (10-15%) sets. You measure performance with business metrics: MAPE, RMSE, bias. And you always compare against a simple baseline to show that the model actually adds value.
Beware of overfitting: A model can memorize historical noise and lose the ability to generalize. Cross-validation and continuous monitoring in production are critical.
Once validated, the model goes into production. It receives fresh data (yesterday's sales, today's inventory, projected weather) and produces updated forecasts, risk probabilities and inventory level recommendations.
For Supply Chain decisions, you need more than an estimate:
“The Forecast is 10,000 units, with an 80% interval between 8,500 and 11,800, and a 15% chance of exceeding 12,500 units.”
This information allows you to design robust inventory policies and real contingency plans.
In Datup, our models generate granular forecasts by SKU, location, channel and customer, with calibrated confidence intervals and automatic explanations of the main drivers.
Predictions are useless if they are not translated into concrete decisions. It's not enough to say “the Forecast went up 20%”. You need to translate that into:
➡️ “You should anticipate the next purchase order from supplier X by one week, increase the Safety Stock on CD North from 500 to 700 units and prioritize production of SKU Y on plant 2.”
Automatic alerts when the model detects a probability of stockout greater than 30%, suppliers with high risk scores or projected delays that impact committed deliveries. These alerts arrive via email, push or are directly integrated into your WMS or purchasing system.
💡 The key point: If your end users can't easily act on the predictions, the project fails even if the models are technically flawless.
Predictive models are not “put and forget”. Without monitoring, they degrade and produce worse and worse predictions.
Mature companies implement MLOps practices that automate the entire cycle: versioning, retraining pipelines, real-time monitoring, automatic rollback if a new model worsens. This makes analytics a robust operational capability, not a one-off project.
For it to work in the Supply Chain, you need five components working in a coordinated manner.
Sales by SKU, inventory movements, observed lead times, quality issues, promotions. For models with annual seasonality, you need at least 2-3 years of clean history. For new products, you use analogy techniques or models with more external variables from day one.
The Dirty History Trap: Five years of data don't work if it's full of errors, undocumented system changes, or unrepeatable events (COVID) that distort patterns. Quality matters more than quantity.
IoT sensors, GPS, up-to-date market data. One of the most powerful applications: demand sensing — adjusting the short-term forecast by incorporating yesterday's sales, retail sell-out, updated inventory position. Leading companies report 30-50% improvements in short-term forecast accuracy.
The brain of the system. From classic time series to gradient boosting and neural networks. Often, the best result is not given by a single model but by a weighted combination of several. Averaging ARIMA predictions with XGBoost and exponential smoothing usually produces more robust Forecasts than any one individually.
Connectors to ERP, WMS, TMS, CRM. Data lake or warehouse in the cloud. Automated ETL pipelines.
The real challenge: In our experience, this is one of the biggest obstacles. A project can have models ready in six weeks but be stuck for six months waiting for access to ERP data. Datup connects directly to your systems with pre-built connectors and maintains integration as part of the service.
The component that closes the loop between prediction and action:
Documented studies report 30-40% improvements in Forecast accuracy with advanced predictive models vs. traditional methods. That translates to:
Predictive analytics combines demand forecasting with variability prediction and replenishment times to calculate safety stock, Reorder point and optimal batches by SKU, location and channel. Less average inventory means less space, less obsolescence, less waste, less financial cost. Reductions of 15-25% in total inventory cost are common.
Models such as ARIMA and SARIMA are still extremely relevant: interpretable, require less data, and work well when historical patterns remain stable.
We have seen teams that insist on using only traditional models for their entire portfolio. The result: acceptable forecasts for 60% of the SKUs (the stable ones) and disasters for the remaining 40%. The solution is not to abandon the classics, but to combine them with more advanced techniques depending on the nature of each product.
Gradient Boosting (XGBoost, LightGBM): The kings of advanced forecasting. They incorporate hundreds of variables and automatically detect which combinations matter for each SKU.
The problem: they're black boxes. An experienced planner doesn't trust what he doesn't understand. That's why explainability is critical — techniques such as SHAP values to show which variables influenced each prediction.
At Datup, we work with models that automatically incorporate external variables, but we also provide clear explanations of what prompted each forecast, allowing the planner to validate judiciously before executing.
The Monte Carlo simulation produces probability distributions instead of a single point. This allows you to calculate exactly how much buffer you need to achieve a target Fill Rate considering the real variability of demand and Lead Time.
It also works for “what if” scenarios: What if they shut down a port for two weeks? What's the impact of losing a critical supplier? Essential for contingency plans.
Predictive analytics doesn't fail because of technology. It fails because of data, integration and people.
Problem number one, without question. Missing, duplicate, inconsistent, outdated data... Around 90% of data professionals perceive that senior management doesn't pay enough attention to data quality. The solution: regular audits, controls at the point of capture and real data governance with managers and standards.
Old ERPs, multiple instances per country, WMS and TMS from different vendors, spreadsheets by mail. At Datup, we directly take care of the integration with your ERP, CRM, WMS and TMS, coordinating with your IT team without interrupting the operation.
Shortage of profiles that combine Supply Chain knowledge with technical skills in statistics and ML. The solution involves internal training, mixed teams and platforms that democratize analytics, tools where the business user operates advanced models without being a data scientist.
The opposite risk of resistance to change. Models can fail in the face of unprecedented events, structural changes, or errors in input data. Maintaining a “human in the loop” is part of intelligent risk management.
Doesn't work: “We want to improve the accuracy of the forecast.”
It serves: “We want to reduce the MAPE of categories A and B from 35% to 25% in 6 months, translated into 40% fewer bankruptcies and 15% less average inventory.”
A simple model with clean data outperforms a sophisticated model with junk data. Regular audits, elimination of duplicates, validation at the point of capture, data governance with managers per domain.
Analytics can't live in a silo. If the planner must open a parallel system, download an Excel and copy numbers manually, adoption will be low. The integration must be smooth.
Successful implementations spend 20% to 30% of their effort on training and change management. The world's most advanced technology doesn't work if users don't use it or trust it.
Without MLOps, projects become “zombie models”: technically deployed but generating diminishing value because no one maintains them.
Sales shares promotions, purchases validate the viability of suggested orders, Finance aligns with cash flow, IT guarantees integration. Predictive analytics must stop being “the project of the planning area” and become a strategic capability of the entire organization.
Predictive analytics in Supply Chain is not something we are aspiring to in the future, now Are there companies using it and they're capturing measurable benefits:
The difference between companies that capture these benefits and those that continue to struggle with Excel isn't budget or technology. It's a decision.
More accurate forecasts and balanced inventories with Artificial Intelligence to align Sales and Operations teams.

.jpg)


.png)