
🇺🇸
If your team makes inventory decisions based on the intuition of the longest-serving person, last week's report, or endless discussions about which number is “the right one”, the problem isn't the data, you probably have plenty of data. The problem is that you don't have KPIs; you have individual metrics that each area interprets in its own way and that are not connected to any specific business objective.
The difference between a team that reacts to problems and one that anticipates them almost always boils down to this: Some measure what matters, others measure what is easy to measure.
In this article, you'll learn what it takes to successfully establish your key KPIs In addition, you will learn about the KPIs most used by Supply Chain professionals in LATAM, named in our study of Supply Chain Trends for 2026.
The KPIs of the supply chain are quantifiable indicators that measure performance in critical dimensions: level of service, inventory, costs, quality and delivery times. But more important than the definition is what distinguishes them from a simple operational report: they are directly linked to business results. Profitability, cash flow, customer retention
Well designed, they detect bottlenecks before they explode and balance objectives that naturally stress each other: more service versus less inventory versus lower cost. That tension doesn't go away with KPIs, but at least it becomes visible and manageable.
The metrics They are specific measures of a specific activity, for example, production of a product per hour, picking lines, stored pallets. Useful for daily monitoring, but not directly related to a strategic objective.
KPIs are a specific subset of metrics with a explicit objective, a clear responsible person and defined actions to move it. A KPI can be comprised of several metrics: the Perfect Order Rate, for example, combines timeliness, completeness, absence of damage and correct documentation in a single number.
The question that helps you distinguish them is, if this indicator falls this week, should anyone in management be concerned? If the answer is yes, it's a KPI.
When purchasing, logistics and commercial look at the same numbers, The S&OP ceases to be a meeting where each area defends its version of reality and it becomes a conversation about what to do. That change seems small. It's not.
The most common mistake is not to measure poorly, it is to measure too much. We have seen teams with 40 indicators on a dashboard that no one reviews, and teams with 6 well-defined KPIs that manage with envious precision.
La SMART methodology remains the most useful framework for defining them. Each KPI must be Specific, Measurable, Achievable, Relevant and with a defined time horizon.
On a daily basis, this is defining what we are measuring, how it is measured or calculated, defining a realistic goal or objective, being consistent with its revision and time horizon, and who is the owner of that goal. As much as when it's going well, how when it's going badly
An example:
“Achieving an OTIF ≥ 96% in the national retail channel before the end of the year, measured monthly, is the responsibility of the supply director.”
Before defining your set of indicators, there are three things that determine which are priorities:
Business model. A food retailer needs double-digit inventory turnover. An industrial spare parts company may have low turnover and that's right, because availability is critical even if the SKU moves little.
Nature of the product. Perishable versus durable, high margin versus low margin, stable demand versus high variability. This determines which inventory and forecasting KPIs are a priority.
Network complexity. Number of warehouses, online and offline channels, dependence on international suppliers with long lead times. Managing a network with a single DC is not the same as coordinating five regional platforms with providers on three continents.
Too many KPIs without focus. If you measure everything, you don't prioritize anything. Five or seven well-chosen strategic KPIs are worth more than thirty indicators that no one knows how to interpret.
Ambiguous formulas or different data. If two people on the same team calculate the same KPI and get different numbers, the problem isn't the data, it's the definition. The meetings end up discussing “how did you calculate it?” instead of “what do we do?”
KPIs without an owner. Each indicator needs a responsible person with a real capacity to influence it and a plan of action when it deviates from the goal.
We group the indicators that were most named in the Supply Chain Trends Study 2026, made by our team. Which we divide into five blocks to cover chain performance in a balanced way: customer service, inventory management, finance, suppliers and warehouse costs.
These are the ones that most directly impact revenue and loyalty. They measure your real ability to deliver on what you promised the customer.
The most demanding service KPI, because it only counts when two conditions are met simultaneously: on-time delivery and full quantity. An order that arrives on time but is incomplete is not a fulfilled OTIF. One that is complete but not late either.
Formula: OTIF = (Orders delivered on time AND complete/Total orders) × 100
Example: If you fulfill 1,000 orders in a month, 920 arrive on time and 950 are complete, but only 880 meet both conditions at the same time, the OTIF is 88%, not the average of 93%.
Benchmark: In retail and mass consumption, ≥ 95% is required. Walmart and other large retailers set standards of up to 98% with penalties below the threshold.
The most comprehensive indicator of the customer's ordering experience. It measures the percentage of orders delivered without any errors considering time, quantity, damage and documentation.
Formula: Perfect Order Rate =% on time ×% complete ×% undamaged ×% with correct documentation
Example: With 97% of on-time deliveries, 98% complete, 99% without damage and 99% with correct documentation: 0.97 × 0.98 × 0.99 × 0.99 = 93.2%. That's the real percentage of perfect orders. The multiplier effect surprises many people the first time they calculate it.
In many industries, ≥ 90% is considered excellent.
It focuses exclusively on the availability of inventory: what percentage of demand is met in the first shipment, without backorders or stock breaks.
Formula: Fill Rate = (Units sent in the first shipment/Units ordered) × 100
Example: A customer orders 1,000 units and ships 930 in the first shipment. Fill Rate of 93%, and the remaining 7% comes as a backorder. In FMCG and retail, every point below 95% represents lost sales or customers looking for alternatives.
Simpler than OTIF: it measures the percentage of orders delivered on or before the committed date, regardless of whether they are complete. Useful as a partial diagnosis to isolate the problem of timeliness from that of availability.
Formula: OTD = (Orders delivered on date/Total orders) × 100
In B2B contracts, it is common to establish a minimum of 95% with penalties for non-compliance.
Inventory is both the biggest asset and the greatest risk. Too much immobilizes capital; too little generates stockouts. These KPIs help to find that balance, which is never static.
Number of times that the Inventory is sold and replenished over a period, usually a year. Measure how efficiently you convert stock into sales.
Formula: ITR = Cost of Sales (COGS)/Average Inventory
Example: Annual COGS of $1,000,000 and average inventory of $200,000 give an ITR of 5. You renew your inventory five times a year.
Benchmark by industry: Supermarkets can have double-digit ITR (12-20×). Fashion or electronic operate in more moderate ranges (4-8×). Critical spare parts or luxury products can have low ITR without that being a problem, because the margin or the criticism justify it. Pursuing a high ITR in categories where availability is the value is a classic mistake.
The number of days you can meet demand with available inventory at the current rate of consumption.
Formula: IDS = Available Inventory/Average Daily Demand
Example: 30,000 units in stock with a sale of 1,000 a day: 30 days of coverage.
An IDS that is too high immobilizes capital and increases the risk of obsolescence. Too low, and you run out of product just when you need it most. The optimal value depends on the replenishment lead time and demand variability, not on a generic reference number.
The proportion of demand that cannot be served at the time of the order and is pending. It's one of the most obvious symptoms of planning problems.
Formula: Backorder Rate = (Backordered Units/Requested Units) × 100
Example: Out of 10,000 units ordered, 800 are left in backorder: 8% rate. If this number grows month by month, you have a problem with demand planning, supply capacity, or both.
How close is your Real demand forecast. It's the root KPI of almost every inventory problem: a bad forecast generates both excess and scarcity, and sometimes both at the same time in different references.
Formula (MAPE): MAPE = Average of |Actual Demand - Forecasted Demand|/Actual Demand × 100
Example: With relative errors of 10%, 15% and 5% in three consecutive months, the average MAPE is 10%, equivalent to an accuracy of 90%. At the product family level, many companies consider 80-85% accuracy to be good. At the individual SKU level, the objectives are more modest because the variability is structurally greater.
Calculating the MAPE manually in Excel for hundreds of SKUs is tedious and prone to errors that distort reading. If your team spends more time calculating the indicator than acting on it, the process is the other way around.
In Datup, you leave forecast accuracy in charge of the software and your team can focus on activities with greater impact. If you think it is something critical that is holding back your operation, you can discuss your situation with the Datup team, and find out if this tool fits your needs.
These are what allow you to bring the supply chain conversation to the boardroom. They connect logistics performance with the language of Finance.
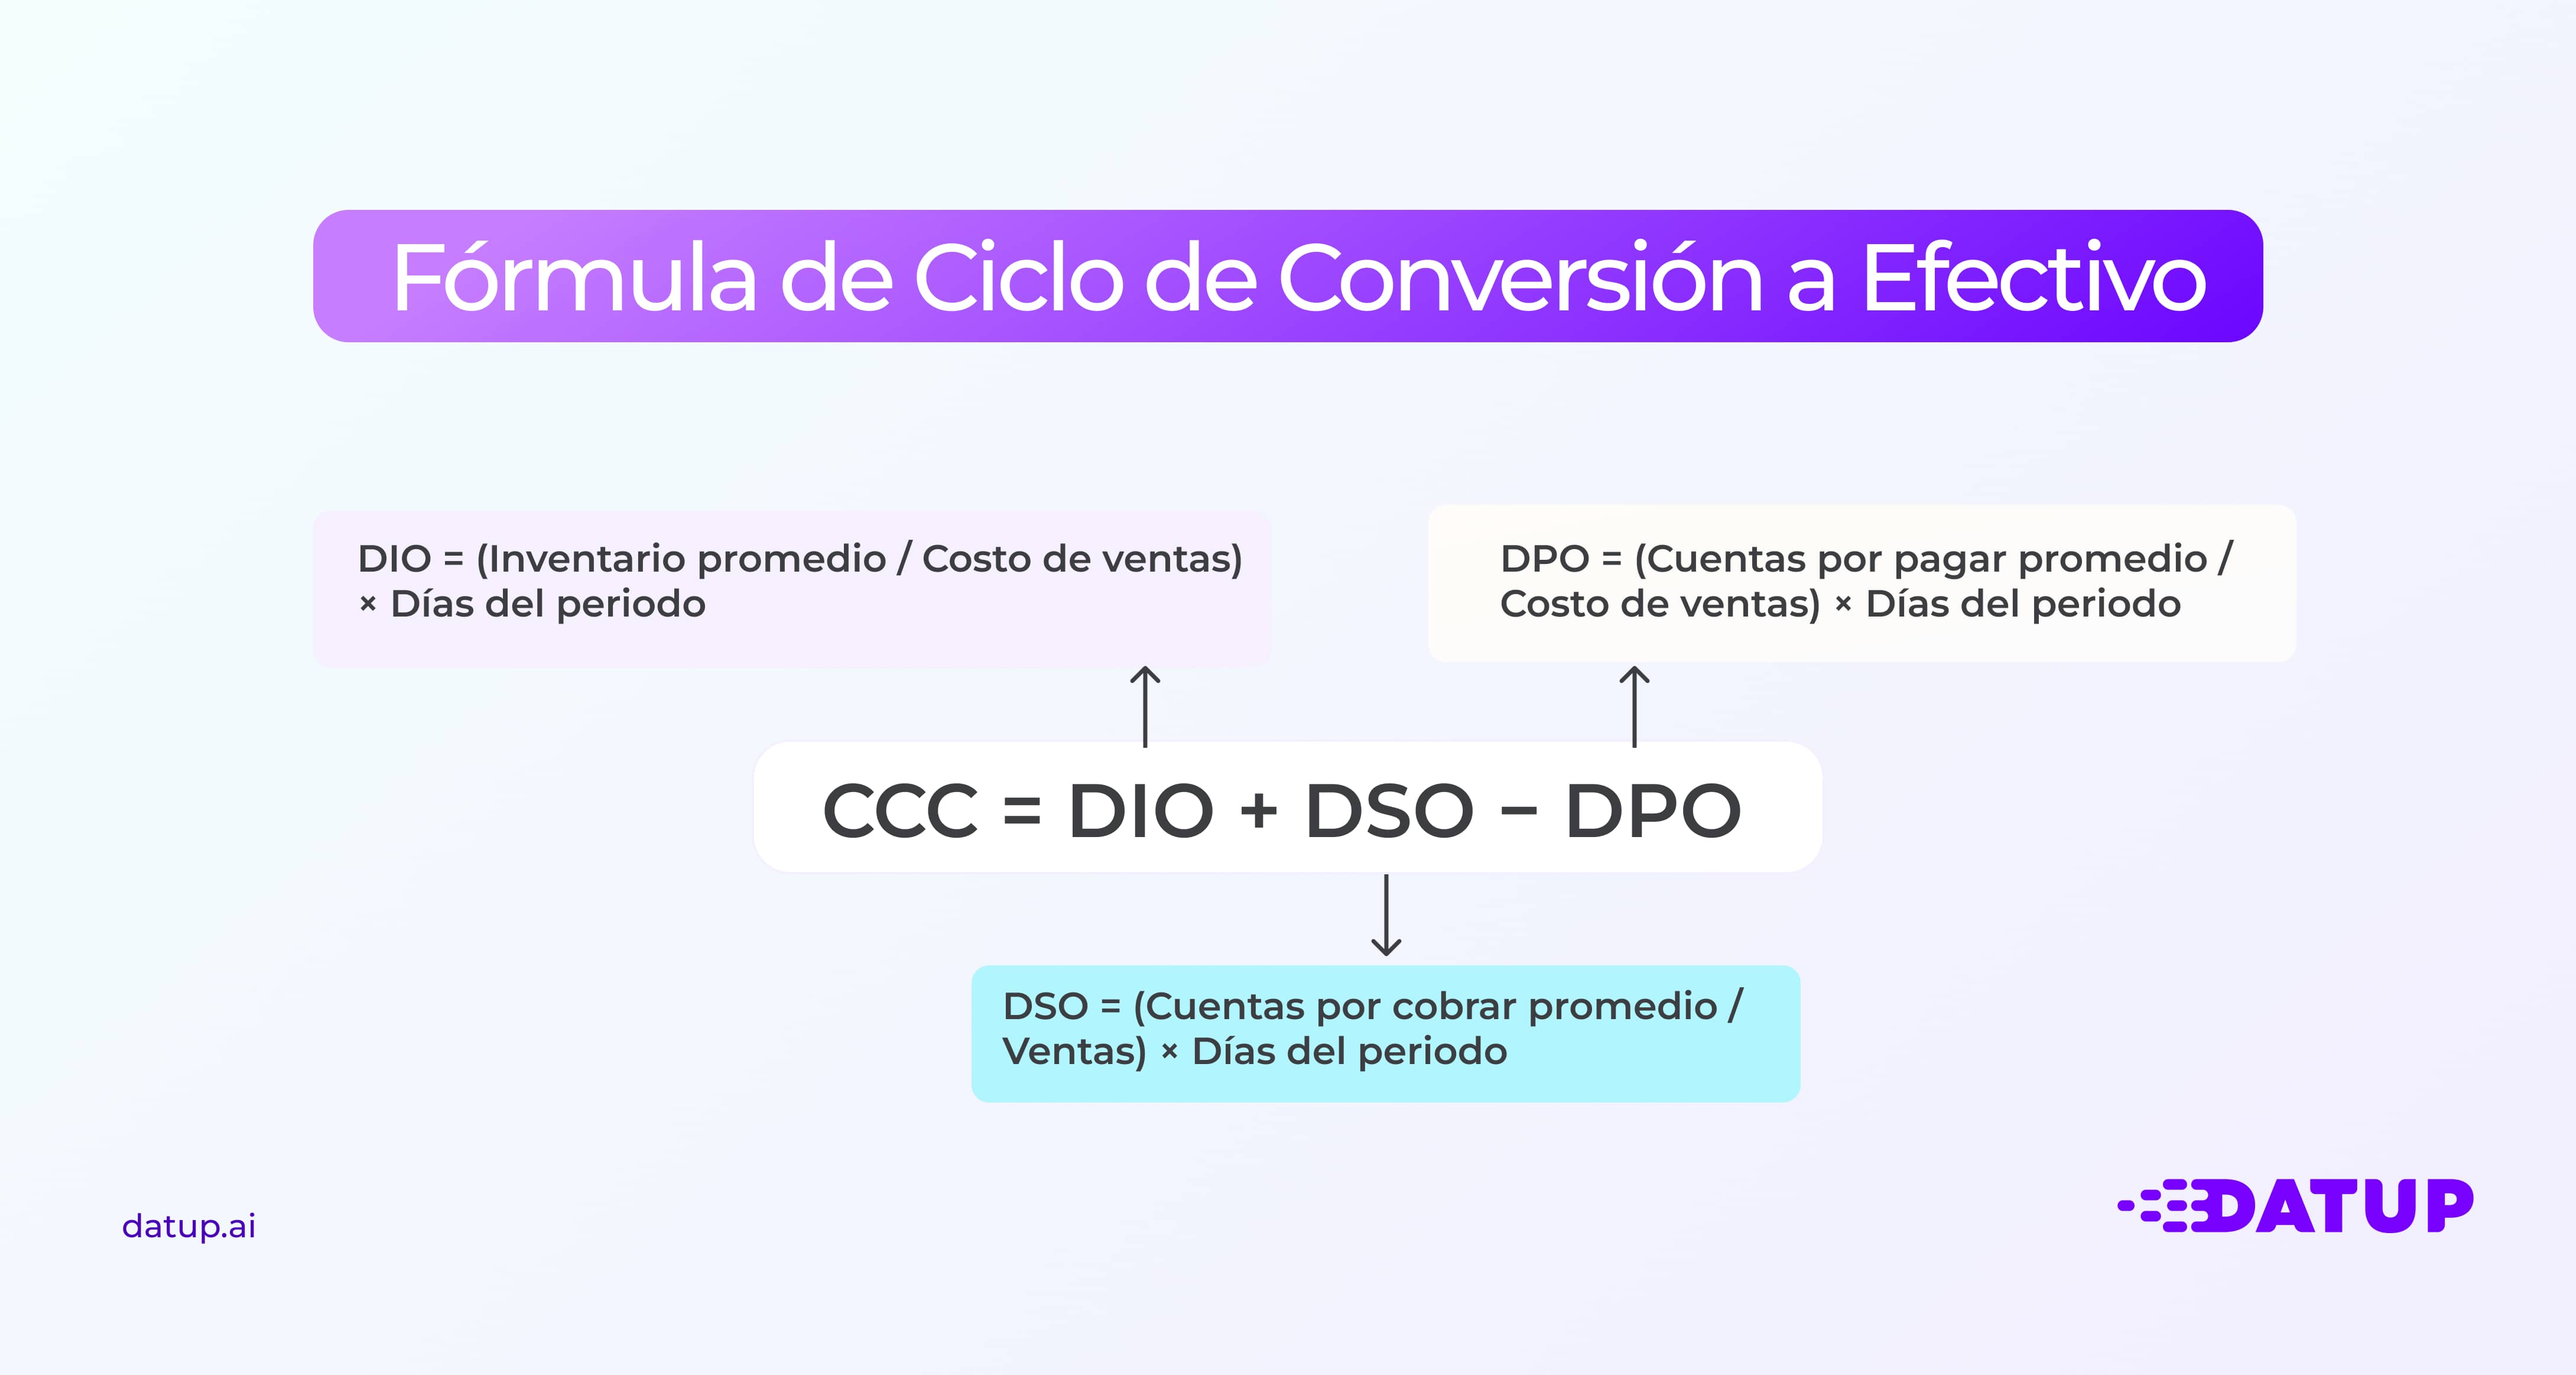
Cash Conversion Cycle is the time it takes for cash invested in inventory to return to the company as collections from customers. For many CFOs, it's the supply chain KPI they're most interested in.
Formula: C2C = DSO + DPO - DPO
Example: 40-day DSO, 50-day DIO, and 35-day DPO result in a 55-day C2C. It means that between paying for the inventory and charging it to the customer, 55 days pass financed with own capital. Reducing this cycle frees up cash without the need for new funding.
How much gross margin you generate for each monetary unit invested in inventory. It is the favorite Finance and Purchasing indicator for evaluating portfolio profitability and making assortment decisions.
Formula: GMROI = Annual Gross Margin/Average Inventory
Example: Annual gross margin of $255,000 and average inventory of $106,462 give a GMROI of ∼2.4. For every $1 invested in inventory, you generate $2.40 in gross margin.
Benchmark: Retail studies show averages of 2.16 in shoe stores and 3.90 in pet stores. Most retailers consider a GMROI ≥ 2.0 to be healthy and very good above 2.25, always compared to the industry itself.
Combine margin and rotation into a single number to show how much you “earn” by rotating inventory at a given speed.
Formula: TEI =% Gross Margin × Inventory Turnover
Example: Margin of 40% with turnover of 10: TEI = 400. A very powerful combination. As a reference, many retailers aim for TEI greater than 150-180 in standard categories.
The real utility of the TEI is in the comparison between categories or SKUs. A product with high margin but slow turnover may have a lower TEI than another with moderate margin but very high turnover. The TEI resolves the debate about which one is more profitable for invested capital.
Your OTIF to the customer starts with the OTIF of your suppliers. What happens upstream determines your ability to comply downstream.
Percentage of purchase orders received on or before the agreed date.
Formula: Supplier OTD = (Orders received on date/Total orders issued) × 100
Example: Of 500 orders in a quarter, 430 arrive on time: OTD of 86%. A supplier that fails in 14% of its deliveries is not a supplier with specific deviations; it is a source of structural variability in your chain. The difference matters, because the answers are different.
Time elapsed from when a purchase order is issued until the material is available for use or sale.
Formula: Total Lead Time = Processing Time + Production or Preparation Time + Transit Time + Receiving and Inspection Time
There are several types: lead time of supply, production, distribution and order-to-delivery. Each one has its specific levers.
A point that many teams ignore: reducing lead time variability is often more valuable than reducing their average value. A supplier that always delivers in 15 days is better than one that delivers between 8 and 22, even if the average is the same. Variability is what forces Maintain more safety stock, not the average.
A composite indicator that integrates defects, compliance and timeliness to evaluate the overall performance of each supplier.
Typical components are:
More mature companies weigh these components in a global SQP index. A common scheme: 50% quality, 30% punctuality, 20% administrative incidents. This index is used for approval, negotiation and joint development programs with strategic suppliers. It's also useful for difficult conversations: it's much easier to justify a change of supplier with a composite index than with a one-off complaint.
The service has a cost. These indicators measure operational efficiency without losing sight of the fact that optimizing only the cost without looking at the service is a classic trap.
Logistic cost of transportation per unit shipped. It can be measured per unit, kilo, order or pallet depending on the operation.
Formula: Freight Cost per Unit = Total Transportation Expenditure/Total Units Shipped
Example: $50,000 in transportation and 25,000 units shipped: $2 per unit. The levers to improve this KPI are load consolidation, route optimization, negotiation with carriers and improvement of truck fill rates.
Degree of use of available storage space.
Formula: Warehouse Utilization = (Space Used/Total Space Available) × 100
A warehouse with very low utilization is oversized. Someone above 85-90% starts to generate its own problems: congested corridors, difficulty maneuvering, picking errors that skyrocket. Optimization levers include improving rotational slotting (The A products near the exits), take advantage of the height with racks or mezzanines and, above all, eliminate obsolete inventory that takes up space without generating any value.
Not all indicators are for all levels of the organization. The common mistake is to present the same dashboard to management, managers and operatives. The result: direction is lost in detail, execution teams don't see the big picture, and everyone ends up looking at what they understand instead of what they need.
Strategic level. Global OTIF, Perfect Order Rate, Cash-to-Cash, GMROI and total chain cost as a percentage of sales. Monthly or quarterly review. Their movements relate to investment decisions, business strategy and risk management.
Tactical level. Fill Rate by category, Forecast Accuracy, inventory turnover, IDS, supplier timeliness, warehouse utilization. They are the responsibility of supply chain, logistics, purchasing and planning managers, who review them weekly or monthly to adjust parameters, plans and agreements with suppliers.
Operational level. Orders prepared by the hour, picking errors, order cycle times, transport incidents, percentage of shipments with problems. More granular, but they must be traced to tactical and strategic KPIs. Optimizing only local productivity without connection to the service level is the perfect recipe for underoptimizing the entire system.
Both types are complementary and that complementarity is the key. An excellent Fill Rate with very low GMROI means that you serve the customer well but destroy profitability. A high GMROI with low OTIF indicates that you optimize margins at the cost of the service. Managing the supply chain well is managing that tension permanently, not resolving one of the two sides.
A good dashboard is a tool that supports decision-making. It integrates ERP, WMS, TMS and planning data, presents KPIs by pyramid level and allows you to drill down to the root cause of a deviation.
The typical steps: define SMART objectives and KPIs, standardize formulas and data sources, build the data model, choose the visualization tool, design differentiated views by role and establish update governance. That last point is the one that is most ignored and the first that fails.
Start with a small set of critical KPIs. Un minimum viable dashboard with five or seven well-defined and proprietary indicators, it is infinitely more useful than one with forty metrics that no one knows how to interpret or who should act when they deviate.
For visualization and integration: Power BI or Tableau work well for consolidating and presenting KPIs interactively. The most difficult thing is not choosing the tool, it's the efficient integration with data sources.
If you manage thousands of SKUs in multiple locations, updating manually in Excel doesn't just consume time, it generates errors that distort decision-making just when you most need to rely on numbers. Direct integration with ERP, WMS and TMS to automatically update forecast, inventory and service indicators is the minimum requirement for the system to work.
For teams that require a more complete solution, there are Supply Chain Management software (SCM) as Datup, which integrate forecasts, inventory management and KPI monitoring in one place, directly connected to business data sources. This allows the team to focus on decision-making, without spending time manually consolidating information.
There is no universal one. The Perfect Order Rate and OTIF are the most representative of the total customer experience because they integrate multiple dimensions of performance. For Finance and Purchasing, GMROI and inventory turnover are often the central indicators. The right answer depends on your company's strategic objectives right now and where the biggest pain is.
OTIF = (Orders delivered on time AND with full quantity/Total orders) × 100
Only orders that meet both conditions simultaneously enter the numerator. A full but late order doesn't count. A punctual but incomplete one either.
It depends on the sector. In consumer goods retailers and supermarkets, rotations of 12-20× are common. In fashion or electronic, between 4-8×. In industrial spare parts or luxury products, low values are acceptable and even desirable, because the criticism or the margin justifies it. Rather than chasing a generic number, the useful thing is to compare yourself with peers in your industry and with your own historical evolution.
The strategic ones (OTIF global, C2C, GMROI), monthly or quarterly. Tactical (Fill Rate, Forecast Accuracy, IDS, OTD providers), weekly or monthly. The operational ones, daily or in real time. Scaling is what allows you to react quickly in the operation without losing long-term vision.
More accurate forecasts and balanced inventories with Artificial Intelligence to align Sales and Operations teams.

.jpg)


.png)