
🇺🇸

Inventory is the most expensive asset that most supply chains manage. Not because any manual says so, but because it immobilizes capital, takes up space, depreciates and, when poorly managed, takes months to reveal the damage it has done. GMROI is one of the few metrics that puts that cost into real perspective: it doesn't tell you how much you're selling, It tells you how much you earn for each weight you have standing on shelves.
The GMROI is a KPI that Measure how many pesos of gross margin are generated by each peso invested in stock. They are the initials of Gross Margin Return on Inventory Investment, or return on gross margin on investment in inventory.
What sets it apart from metrics such as inventory turnover is that it incorporates profitability. You can have a very high turnover selling at ridiculous margins, and the GMROI will make that clear to you in no uncertain terms. It also works the other way around: a product with slow rotation can have an excellent GMROI if the margin is high enough. That tension between volume and profitability is exactly what this metric solves.
Where it is most used: retail, distribution and any operation where the product mix is complex and space or capital are real limitations. In practice, it is the metric with which category managers justify —or question— the space occupied by each product family.
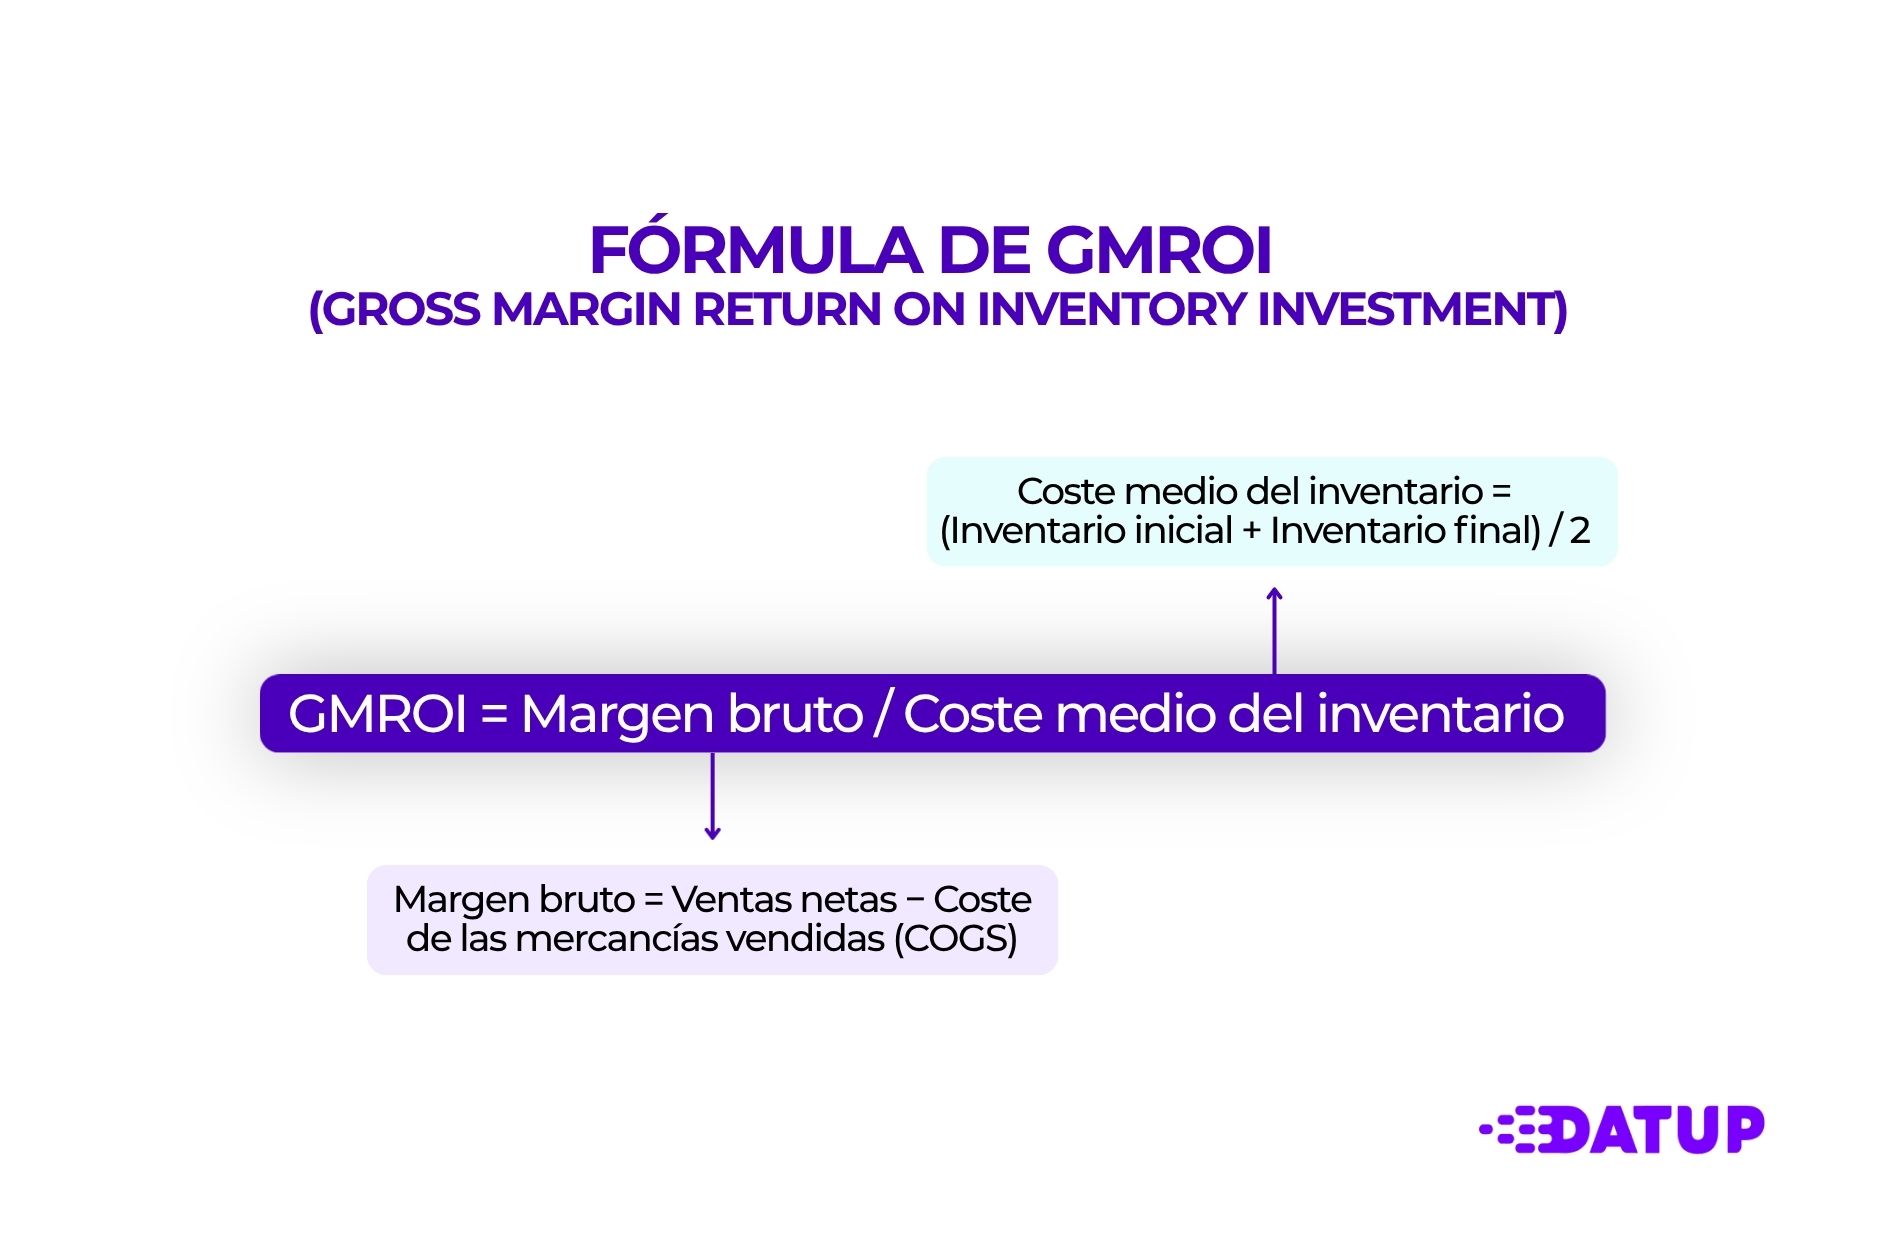
The formula has two components:
GMROI = Gross Margin/Average Inventory Cost
Where:
Unfolded:
GMROI = (Sales − COGS)/Average Inventory Cost
A GMROI of 2.5 means that for every dollar invested in inventory, the transaction generates $2.5 in gross margin. To cover operating costs and generate net profit, most retail bibliographic references place the minimum threshold around 1.0, although in practice that number is too low for any transaction with a real cost structure.
Suppose a category of power tools at a regional distributor:
GMROI = $255,000/$160,000 = 1.59
Is that 1.59 good? It depends on the sector and what you compare it to within the same portfolio. In isolation, the number does not decide anything. In context, It can be the difference between expanding that category or reducing it by half.
The GMROI It does not have a universal value. A 2.0 can be mediocre in nutrition and excellent in industrial machinery. Here are the usual ranges, but with the caveat that industry benchmarks have a limited lifespan and should be validated against your own historical series before using them to make decisions:
The feed has very high rotations with tighter margins but the volumes compensate. Industrial machinery may have inventory standing still for months, but if the unit margin holds up, the GMROI is still reasonable. What doesn't hold up well in any sector is a low margin with slow rotation: there the GMROI shows it to you without anesthesia.
Calculating the aggregate GMROI of the entire operation is a warm-up exercise. Where it really starts to be useful is when you break it down by category, subfamily or SKU and cross it with an ABC—XYZ classification.
ABC classifies by sales volume or margin provided:
XYZ classifies by demand variability:
Crossing both dimensions with the GMROI, cases that require immediate attention are usually predictable, although no less frequent:
AX type SKUs with low GMROI: high turnover, stable demand, but weak margin. The perfect candidate to review pricing or negotiate conditions with the supplier. Sometimes they are anchor products that carry volume but poorly finance the rest of the operation.
CZ type SKUs with high GMROI: low turnover, erratic demand, but high margin. Here the trap is in the security inventory. If you have three months of stock of a product that you sell twice a year at a good price, the real GMROI is worse than it seems in the specific calculation.
CZ type SKUs with low GMROI: this is buried capital. Products that don't rotate, that generate little margin and that take up space and management capacity. They are the candidates to discontinue, consolidate or transfer to another channel.
A well-executed ABC—XYZ analysis with GMROI above can reveal that between 15% and 25% of the catalog is actively destroying value, not just not generating it. That's not hyperbole: it's what appears in most portfolio analyses when done with real data.
The GMROI increases in two ways: increasing the gross margin or reducing the average inventory. In practice, the two are interdependent and decisions are rarely clean.
The most common mistake when someone identifies a low GMROI is to place a stock reduction order without first reviewing the parameters that generate it. If the problem is a long lead time with a supplier, cutting back on safety stock without attacking delivery variability only creates breakages. If the problem is a disproportionate MOQ, you have to negotiate before optimizing.
The levers that work here:
Raising the margin without losing volume is the uncomfortable part, but there's more room for maneuver than it seems if you're working with data:
The GMROI calculated once a quarter is a retrospective indicator. Integrated into the Cycle of S&OP, is starting to have predictive value. If the demand team is projecting growth in a category with low GMROI, that information should be on the table before approving the purchasing plan, not after executing it.
Some supply chain teams also use it as a prioritization criterion in situations of scarcity: when there are capacity or capital restrictions, first allocating available inventory to the SKUs with the highest GMROI is a more defensible decision than doing so by historical volume.
A metric that ignores storage operating costs, capital cost, or distribution expenses has obvious limits. The GMROI works with gross margin, not with a net margin, and that means that two products with the same GMROI can have very different net returns if one requires special handling, controlled temperature or a high return rate.
That said, GMROI remains one of the most direct tools for visualizing where the capital invested in inventory is working well and where it is sleeping. In operations with large catalogs, where the pressure to add references is constant and physical or financial space is not growing at the same rate, having this number by SKU and category changes the conversation. It ceases to be a discussion about which product sells the most and becomes one about which product makes the best return on the capital you have available. Which is not the same thing.
Felipe has specialized in the application of artificial intelligence to optimize supply chains, helping companies to predict demand, manage inventories and determine the ideal times to buy raw materials.

.jpg)

.png)