
🇺🇸
In summary, understanding and effectively managing the Cash Conversion Cycle (CCC) is crucial for businesses to maintain liquidity and optimize working capital. By aligning supply chain operations with financial strategies, companies can enhance their cash flow, make informed decisions, and ultimately drive sustainable growth.
The cash conversion cycle (CCC), by Cash Conversion Cycle) measures how many days pass between when your company disburses cash to purchase inventory and when that cash returns to the cash register after sale and collection.
If your supply chain team and your financial management aren't talking to this same number, they're making decisions with half the information.
When you buy merchandise, the money comes out of your box. That money is “trapped” in the process: first as inventory, then as accounts receivable, until the customer pays and the cash returns. The CCC measures exactly those days.
Lawrence Gitman formalized this concept as a tool for estimating liquidity and working capital needs. Since then, it has become a reference KPI for both financial directors and supply chain managers, because it connects the operation with the financial health of the business directly and unambiguously.
You'll also find it as a cash cycle, cash cycle, net operating cycle or simply cash cycle. The formula is the same in all cases.
The operating cycle adds up the days it takes for inventory to sell plus the days it takes you to collect that sale. Measure the entire period from when you purchase the merchandise until you receive payment from the customer.
The CCC goes one step further: it discounts the days it takes to pay your suppliers. That difference matters a lot.
Operating cycle = DIO + DSO
Cash Conversion Cycle = DIO + DSO − DPO
In practice, this means that the funding provided to you by your suppliers reduces your actual exposure. If you have a 90-day operating cycle but you pay providers for 60 days, your CCC is 30. Two-thirds of your cycle is being funded by the provider, not you.
The problem appears when that advantage disappears. If you change suppliers or renegotiate conditions and that time is reduced from 60 to 20 days, Your need for working capital skyrockets without your sales having changed a weight.
The Cash Conversion Cycle is not a data that is calculated once for a report and is archived. Well used, it tells you where your company's money is at all times and what operational decisions are holding it back.

Some specific uses:
From the supply chain, CCC is especially valuable because it combines operational efficiency with financial performance. A high CCC may indicate excess inventory, long lead times, credit policies that are too lax, or payments to suppliers that are too fast. All these problems can be solved from purchasing, planning, logistics and credit and collection, not from finance alone.
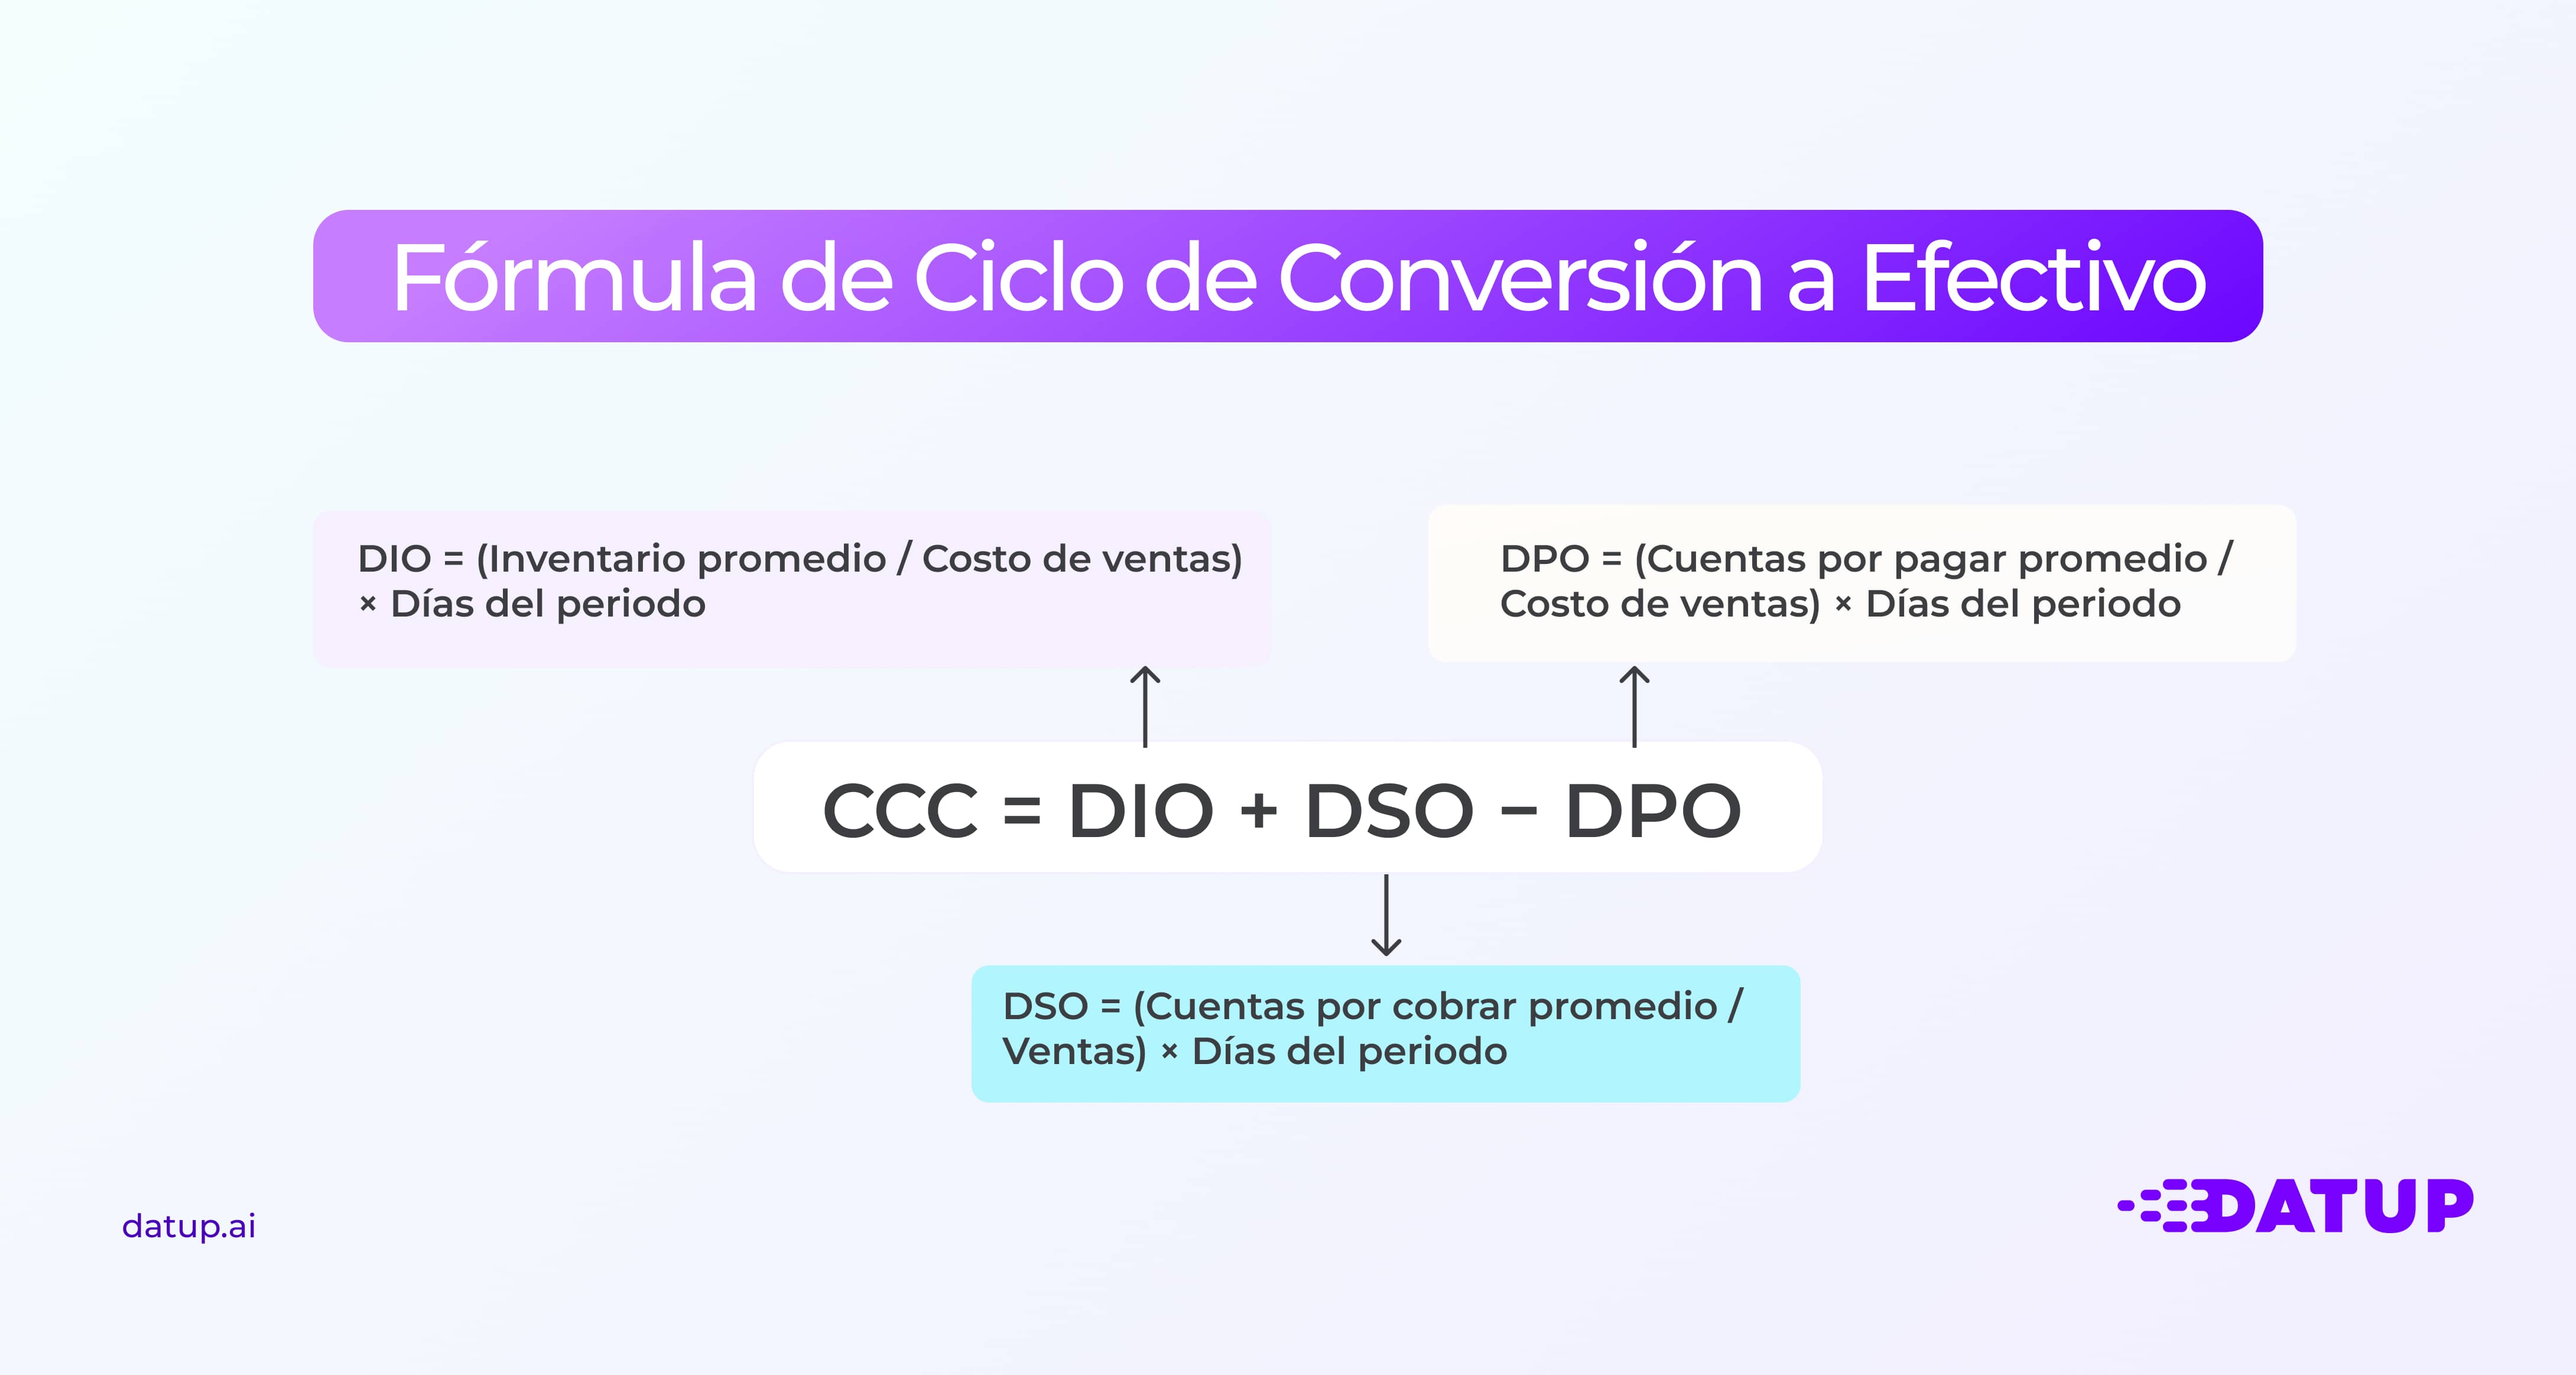
CCC = GOD + SO − DPO
The DIO (Days Inventory Outstanding) measures how many days on average your inventory stays before it's sold.
DIO = (Average Inventory/Cost of Sales) × Days of the period
The average inventory is calculated by adding the beginning and ending inventory of the period and dividing by two. If you use only the final balance and you have seasonality marked, the number will be distorted.
A high DIO means that the inventory is asleep more days before it is converted to a sale. One that is too low, without a good replenishment system behind it, can be a sign of a risk of stockout.
The DSO (Days Sales Outstanding) measures how many days it takes for your company to get paid after making a sale.
DSO = (Average Receivables/Sales) × Days of the period
In B2B, a high DSO is common. When it goes on unchecked, it's a sign of credit risk, weak collection processes, or both. Lowering the DSO frees up cash immediately, without the need to increase sales.
The DPO (Days Payables Outstanding) measures how many days it takes on average to pay your suppliers.
DPO = (Average Accounts Payable/Cost of Sales) × Days of the period
A high DPO is favorable to the buyer: you're using the supplier's capital to finance your operation. Extending it excessively, however, can damage the business relationship or generate a shortage if the supplier begins to prioritize who pays first. The key is to maximize the DPO within the agreed deadlines, without leading to delinquency.
Let's work with a concrete example.
Consumer distribution company, 90-day period:
We calculated the DIO: ($5,000,000/$18,000,000) × 90 = 25 days
Inventory takes an average of 25 days to sell.
We calculated the DSO: ($6,250,000/$25,000,000) × 90 = 22.5 days
It takes an average of 22 or 23 days for customers to pay.
We calculated the DPO: ($3,600,000/$18,000,000) × 90 = 18 days
The company pays suppliers on average for 18 days.
Finally, we calculated the CCC: 25 + 22.5 − 18 = 29.5 days
The company needs to finance almost 30 days of operation on its own account before recovering the cash invested. If the business grows by 20%, that working capital gap grows by the same proportion.
Now imagine that purchases negotiate extending payment terms to suppliers from 18 to 35 days. The CCC drops from 29.5 to 12.5 days, freeing up working capital without touching sales or inventory.
Understanding the logic with an example is useful. But if you have multiple categories, lines of business or need to monitor monthly developments, doing so manually on a blank sheet increases the risk of error and consumes time that you should invest in analyzing, not calculating.
We have a free tool where you directly enter your balance sheet balances (inventory, accounts receivable, accounts payable, cost of sales and sales) and the tool automatically calculates DIO, DSO, DPO and CCC for the period you define. It includes a historical comparison section to see the evolution quarter by quarter, which is where the CCC begins to tell a story.
Use Free Cash Conversion Cycle calculator
This is the most common case. It means that your company pays suppliers before charging customers, so you need to finance that interval with equity or bank debt.
If your CCC is 45 days and your monthly sales are $10 million MXN, you need approximately $15 million in working capital to sustain that cycle. A positive CCC is not bad by definition. The problem appears when it grows out of control, when your direct competitors have significantly shorter cycles, or when the company has no liquidity to sustain it.
A negative CCC means that you charge customers before paying suppliers. In fact, you are trading with third-party capital. The most cited cases in financial analysis are Amazon, Apple and Dell:
What these three companies have in common is a combination of three factors that are not available to most: very high bargaining power with suppliers (DPO over 100 days), almost immediate collections from end customers (DSO close to zero) and very efficient inventory management (low DIO). Not all companies can aim for a negative CCC, but they can work systematically on all three levers to reduce it.
A lower CCC means less need for operating cycle funding and greater efficiency in the use of working capital. That said, there are relevant nuances:
A low CCC achieved at the expense of damaged business relationships — suppliers who cut off your supply, customers that don't return — is not sustainable. A low CCC due to high real turnover and good negotiations is indeed an indicator of solid trading. And a high CCC in a sector where everyone is high — industrial manufacturing, for example — isn't necessarily an alarm signal; what matters is your position vis-a-vis your direct peers.
Improving the CCC requires working all three levers in a coordinated manner. An aggressive improvement in a single dimension (squeezing the DPO without taking care of the relationship with suppliers, for example) can deteriorate your supply chain and create risks greater than the financial benefit you obtain.
Inventory is where there is usually the greatest potential for improvement in commercial and industrial companies.
In companies with portfolios of thousands of SKUs, we have seen DIO reductions of between 15 and 30 days only with improvements in demand planning, without changing suppliers or logistics processes.
The DSO is joint responsibility for credit and collection, sales and supply chain, because errors in orders or deliveries delay billing.
The DPO is the lever that can most quickly improve the CCC, but also the one that requires the most care.
Calculating the CCC seems simple and it is, but in practice there are errors that distort the result and lead to wrong decisions.
The income statement may show utilities that have not yet been charged. The CCC tells you exactly where your money is and how long it will take for it to be available to finance the next cycle.
The most common trap is to calculate it once, save it in a report, and not review it until there's a problem. Its real value appears when it is converted into a monthly monitoring indicator, compared against one's own history and against industry references, broken down by category, supplier or channel, not as a single aggregated number that hides more than it shows.
If your company manages thousands of SKUs, multiple vendors, and different distribution channels, such tracking in Excel becomes unfeasible without making mistakes. In Datup we work with supply chain teams that need real-time visibility on their inventory, turnover and working capital indicators, directly integrated with their ERP, WMS and sales systems data. The idea is to go from calculating the CCC once a quarter in a spreadsheet to having it available with the level of detail you need to act: by category, by supplier, by channel or by location.
If you want to see what your operation would look like, we can show you the live platform and share the estimated return from the first call. Schedule a demo here.
The number of days that pass between paying your suppliers and charging your customers. The shorter, the less working capital you need to operate.
CCC = GOD + DSO − DPO. DIO is inventory days, DSO accounts receivable days, and DPO accounts payable days.
No. It means that you get paid before you pay, which is financially very favorable. The important thing is that this condition is sustainable and does not jeopardize the relationship with your suppliers or the customer experience.
The operating cycle adds up to DIO + DSO. The CCC also subtracts the DPO, incorporating the funding given to you by your suppliers. The CCC is always equal to or lower than the operating cycle.
Straightforward: each additional day of CCC means more days of operation that you must finance on your own. If your CCC goes up 10 days and your daily sales are $500,000 MXN, you need an additional $5,000,000 MXN of working capital.
From the balance sheet (inventory, receivables, accounts payable) and the income statement (sales and cost of sales). Most ERP exports this data directly.
Felipe has specialized in the application of artificial intelligence to optimize supply chains, helping companies to predict demand, manage inventories and determine the ideal times to buy raw materials.

.jpg)

.png)